Message Boards Message Boards

0
|
10285 Views
|
6 Replies
|
8 Total Likes
View groups...
Share
Share this post:

Integration after importing data, how to set the variables

Posted 11 years ago
Dear Community :

I'm learning doing the integration.
I know how to import data and integration.
But I do not how to set the variables after importing it.
The screencapture is as below.

Please advise me 
Thanks in advance

Lee

POSTED BY: Chenyen Lee
6 Replies
Posted 11 years ago
Try this. Ammend the file path and the need to flatten/Partition as you need.  The attached picture is using your data from your dropbox, renamed.


 dtsa = Import["test2.xls", {"Data"}]; dtsa =
 
  Partition[Flatten[dtsa], 2]; r1 = Min[dtsa[[All, 1]]]; r2 =
  Max[dtsa[[All, 1]]]; f = Interpolation[dtsa];
 model = a x Exp[-b x];
 fit = FindFit[dtsa, model, {a, b}, x]
 modelf = Function[{t}, Evaluate[model /. fit]];
 Print[Show[Plot[{f[x], modelf[x]}, {x, r1, r2}],
   ListPlot[dtsa, PlotStyle -> Red], PlotRange -> All,
  ImageSize -> {800, 800}]]; .1 Total[dtsa[[All, 2]]]
NIntegrate[f[x], {x, r1, r2}]
NIntegrate[modelf[x], {x, r1, r2}]


POSTED BY: Paul Cleary
Posted 11 years ago
Thank you so much for the instruction.
I understand much more how to do the interpolation and integral now.
But I still do not know how to set the variables after importing data,  how to correspond the importing data to variables
Please advise me.
The data  O8p18Ft.xls.
        (2.5, 2.74)
         (2.6, 52 )
         (2.7, 6.6 )
         ....
         ...
        (20, )   is attached in the link below

https://www.dropbox.com/s/f90z14hxwgbzxn6/O8p18Ft.xls

POSTED BY: Chenyen Lee
Let's make up some data close to yours:
data = Table[{x, 700 x Exp[-x] + 50 RandomReal[]}, {x, 0, 9, .1}];

When you have just list of points you have three choices for integration:
  • integrate data
  • integrate interpolation
  • integrate model fit
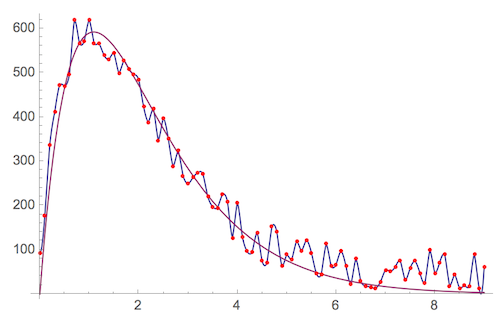
Let's first get all three on the same figure.
(* interpolation *)
f = Interpolation[data];

(* model fit *)
model = a x Exp[-b x];
fit = FindFit[data, model, {a, b}, x]
modelf = Function[{t}, Evaluate[model /. fit]];
Out[] = {a -> 678.552, b -> 0.892996}

Show[
Plot[{f[x], modelf[x]}, {x, 0, 9}],
ListPlot[data, PlotStyle -> Red]
, PlotRange -> All]


Now we can compute the integrals - which all are pretty close to each other. You should pick a method more appropriate to your case. The 1st one - integration of data - is the simplest. You just have to sum all the Y-values and multiply them by the step between the points - in our case it is 0.1 .
 (* integrate data *)
 .1 Total[data[[All, 2]]]
 Out[]= 1911.23
 
 
 (* integrate interpolation *)
 NIntegrate[f[x], {x, 0, 9}]
 Out[]= 1901.01
 

(* integrate model fit *)
NIntegrate[modelf[x], {x, 0, 9}]
Out[]= 1756.51
POSTED BY: Vitaliy Kaurov
You may take a look at this funciton after you import the data: 
http://reference.wolfram.com/mathematica/ref/Interpolation.html
POSTED BY: Shenghui Yang
Posted 11 years ago
I would like to know how to do a definite integral of sigma(E) over an defined region.

The distribution of Sigma is  http://ppt.cc/-5Z5  , and the values are in the file O8p18Ft.xls.


ex.   The sigma(E) varies with E
         (2.5, 2.74)
         (2.6, 52  )
         (2.7, 6.6 )
         ....
         ...
        (20,    )
       
POSTED BY: Chenyen Lee
Hi. I'm not sure what you would like to do with Mathematica. What do you want this code to do? 

Import will give you a list of numbers, not a function. If you would like to make the list of numbers into a function, please try using the Interpolation function. 

If you are new to Mathematica, you may want to read an overview of how to use it. You can do this by looking at the Mathematica Virtual Book.
POSTED BY: Sean Clarke
Reply to this discussion
Community posts can be styled and formatted using the Markdown syntax.
Reply Preview
Attachments
Remove
or Discard

Group Abstract Group Abstract