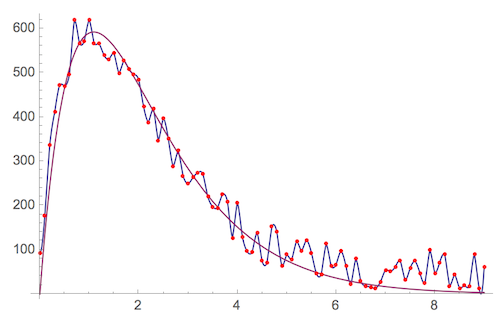
Let's make up some data close to yours:
data = Table[{x, 700 x Exp[-x] + 50 RandomReal[]}, {x, 0, 9, .1}];
When you have just list of points you have three choices for integration:
- integrate data
- integrate interpolation
- integrate model fit
Let's first get all three on the same figure.
(* interpolation *)
f = Interpolation[data];
(* model fit *)
model = a x Exp[-b x];
fit = FindFit[data, model, {a, b}, x]
modelf = Function[{t}, Evaluate[model /. fit]];
Out[] = {a -> 678.552, b -> 0.892996}
Show[
Plot[{f[x], modelf[x]}, {x, 0, 9}],
ListPlot[data, PlotStyle -> Red]
, PlotRange -> All]

Now we can compute the integrals - which all are pretty close to each other. You should pick a method more appropriate to your case. The 1st one - integration of data - is the simplest. You just have to sum all the Y-values and multiply them by the step between the points - in our case it is 0.1 .
(* integrate data *)
.1 Total[data[[All, 2]]]
Out[]= 1911.23
(* integrate interpolation *)
NIntegrate[f[x], {x, 0, 9}]
Out[]= 1901.01
(* integrate model fit *)
NIntegrate[modelf[x], {x, 0, 9}]
Out[]= 1756.51