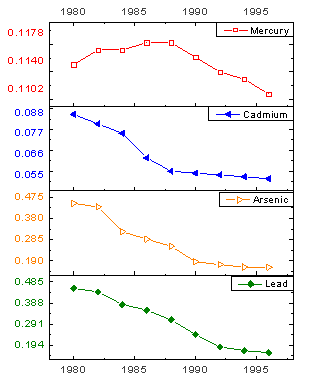
I do not believe this capability exists in Mathematica 9, at least not without a great deal of custom graphics programming. However, I think it would be a very valuable enhancement, which I have in the past requested of our friends at WRI,
At one time, it was common to display such data sets together by introducing different axes. For two data sets it was common to have separate axes on the left and right sides. For more than two data sets this becomes cluttered. Today, a form of stacked graph finds more favor. Below is a clip from the web:

If these data were graphed using the same y-axis, the features would be less obvious. There are of course more extreme examples. Placing them on a Log graph would produce a different view, and a data set that contains negative values can never be shown on a log graph.
I would dearly love to see capabilites like this added to Mathematica as built in capabilities.
Best regards,
David