Message Boards Message Boards

0
|
24257 Views
|
10 Replies
|
2 Total Likes
View groups...
Share
Share this post:

I wish to plot two Lists in a same single graph..

Posted 10 years ago
I have the following simple program

v1 = {}; v2 = {};
For[t = 0, t < 100, t = t + 1,
 y = 2 t + 3;
 z = 4 t - 8;
 AppendTo[v1, {t, y}];
 AppendTo[v2, {t, z}];
 ]


This program generates two distinct lists. Named as "v1" and "v2" having elements in the form of {t,y}, {t,z} respectively.  Now I wish to plot the Lists "v1" and "v2" on a same single graph having "t" variable on x - axis.

Thanks in advance.
POSTED BY: abhishek sharma
10 Replies
Hi,
Show[{ListPlot[v1], ListPlot[v2]},PlotRange->All]
might do the trick.

M.
POSTED BY: Marco Thiel
It's not working as per my reqiurement..
Pleaz suggest some other method
POSTED BY: abhishek sharma
Posted 10 years ago
How about this-
ListPlot[{v1, v2}, PlotLegends -> {"v1", "v2"}]
POSTED BY: Girish Arabale
That's the same as the previsous solution!
v1 = {}; v2 = {};
For[t = 0, t < 100, t = t + 1, y = 2 t + 3;
z = 4 t - 8;
AppendTo[v1, {t, y}];
AppendTo[v2, {t, z}];]

Show[{ListPlot[v1], ListPlot[v2]}, PlotRange -> All]


I do not understand how that is not working as per the requirement. 
 Now I wish to plot the Lists "v1" and "v2" on a same single graph having "t" variable on x - axis.

v1 and v2 are in the same single graph. The time is on the x-axis. This seems to do exaclty what you want. What is the requirement that it does not fulfil?
POSTED BY: Marco Thiel
Respected @Marco Thiel and  @Girish Arabale,
Thanks for ur reply,
This Mathod is appropriate when The range on Y- axis of both the Graphs are Compatible with each other.
But In case when the range of both the Lists vary conciderably , then we persist a problem....
v1 = {}; v2 = {};
For[t = 0, t < 100, t = t + 1, y = 2 t^3 + 3;(*I have replaced "y = 2 t + 3" with "y = 2 t^3 + 3"*)
z = 4 t - 8;
AppendTo[v1, {t, y}];
AppendTo[v2, {t, z}];]
Show[{ListPlot[v1], ListPlot[v2]}, PlotRange -> All]
POSTED BY: abhishek sharma
Respected @Marco Thiel and @Girish Arabale,
Thanks for ur reply,
This Mathod is appropriate when The range on Y- axis of both the Graphs are Compatible with each other.
But In case when the range of both the Lists vary conciderably , then we persist a problem....
v1 = {}; v2 = {};

For[t = 0, t < 100, t = t + 1, y = 2 t^3 + 3;(*I have replaced "y = 2 t + 3" with "y = 2 t^3 + 3"*)
z = 4 t - 8;
AppendTo[v1, {t, y}];
AppendTo[v2, {t, z}];]
Show[{ListPlot[v1], ListPlot[v2]}, PlotRange -> All]
POSTED BY: abhishek sharma
Insteed,
I have have Found a folowing small solution of it...
I have attached a small proggrame here with it.. Please find in attachments...

Please suggest an appropriate method of solving it...


In this mathod we have two Different Verticle axis for both the Plots, this solves our ploblem..
Attachments:
POSTED BY: abhishek sharma
Oh, I see. Using two different axes is certainly one possibility. Another one is to use a Log plot:
ListLogPlot[{List1, List2}]


The advantage of your method is that the curves do not look "distorted". But if you get used to the logarithmic represenation it is actually easy to read and there is the advantage that one can more easily compare the values of the two curves on a sigle axis.

M.
POSTED BY: Marco Thiel
Posted 10 years ago
I do not believe this capability exists in Mathematica 9, at least not without a great deal of custom graphics programming. However, I think it would be a very valuable enhancement, which I have in the past requested of our friends at WRI,

At one time, it was common to display such data sets together by introducing different axes. For two data sets it was common to have separate axes on the left and right sides. For more than two data sets this becomes cluttered. Today, a form of stacked graph finds more favor. Below is a clip from the web:


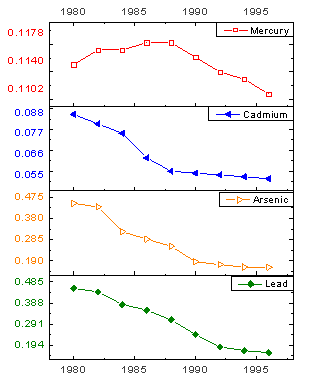
If these data were graphed using the same y-axis, the features would be less obvious. There are of course more extreme examples. Placing them on a Log graph would produce a different view, and a data set that contains negative values can never be shown on a log graph.

I would dearly love to see capabilites like this added to Mathematica as built in capabilities.

Best regards,
David
POSTED BY: David Keith
Reply to this discussion
Community posts can be styled and formatted using the Markdown syntax.
Reply Preview
Attachments
Remove
or Discard

Group Abstract Group Abstract