Like so:
fit = NonlinearModelFit[data[[All, {1, 2}]], a*Exp[b x], {a, b}, x]
For the data at hand this gives you a=231.454 and b=-0.13052. You can display the function:
Normal[fit]
If you want to plot everything use:
Needs["ErrorBarPlots`"];
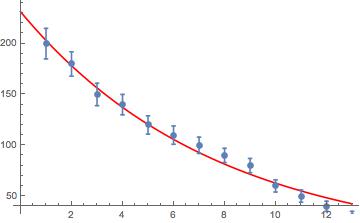
Show[Plot[Normal[fit], {x, 0, 13}, PlotStyle-> Red], ErrorListPlot[Table[{data[[i, {1, 2}]], ErrorBar[10*data[[i, 3]]]}, {i, 1, Length[data]}]]]
which gives
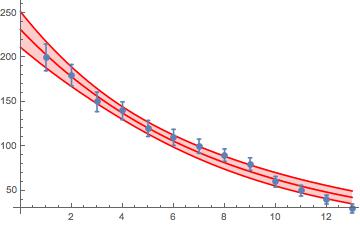
You might also want to plot the 99% confidence bands like so:
Show[Plot[{Normal[fit], fit["MeanPredictionBands", ConfidenceLevel -> .99]}, {x, 0, 13}, PlotStyle -> Red, Filling -> {2 -> {1}}],
 ErrorListPlot[Table[{data[[i, {1, 2}]], ErrorBar[10*data[[i, 3]]]}, {i, 1, Length[data]}]]]
That gives
This fit does not take the errors into consideration. If you want to do that you might have to attach weights to the data points.
Cheers,
Marco


