Dear Sarmed,
<< ErrorBarPlots`

data = {
  {1, 200.0, 1.5},
  {2, 180.0, 1.2},
  {3, 150.0, 1.1},
  {4, 140.0, 1.0},
  {5, 120.0, 0.9},
  {6, 110.0, 0.9},
  {7, 100.0, 0.8},
  {8, 90.0, 0.7},
  {9, 80.0, 0.7},
  {10, 60.0, 0.6},
  {11, 50.0, 0.6},
  {12, 40.0, 0.5},
  {13, 30.0, 0.5}}

ErrorListPlot[
 Table[{data[[i, {1, 2}]], ErrorBar[10*data[[i, 3]]]}, {i, 1,
   Length[data]}]]
gives
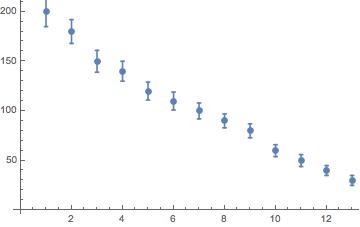
Note that I have multiplied the errors by 10, because they are so small that do not see the bars on the plot if you do not do this.
You can also use functional programming:
ErrorListPlot[Transpose[{data[[All, {1, 2}]], ErrorBar /@ (10*data[[All, 3]])}]]
Cheers,
M.


