Message Boards Message Boards

How do I Plot data with errorbars?

Posted 10 years ago

If I have a list like follows, how do i Plot it. In the first column there are the x values, in the second the y(x) and in the last one the errors of y(x). Can I use ErrorListPlot? Can I just give the function a list of 3-tuple with {{x,y(x),errors},.... }? Thank you very much.

x y(x) errory(x)

1 200.0 1.5

2 180.0 1.2

3 150.0 1.1

4 140.0 1.0

5 120.0 0.9

6 110.0 0.9

7 100.0 0.8

8 90.0 0.7

9 80.0 0.7

10 60.0 0.6

11 50.0 0.6

12 40.0 0.5

13 30.0 0.5

POSTED BY: Sarmed Hussain
9 Replies

Dear Sarmed,

<< ErrorBarPlots`

data = {
  {1, 200.0, 1.5},
  {2, 180.0, 1.2},
  {3, 150.0, 1.1},
  {4, 140.0, 1.0},
  {5, 120.0, 0.9},
  {6, 110.0, 0.9},
  {7, 100.0, 0.8},
  {8, 90.0, 0.7},
  {9, 80.0, 0.7},
  {10, 60.0, 0.6},
  {11, 50.0, 0.6},
  {12, 40.0, 0.5},
  {13, 30.0, 0.5}}

ErrorListPlot[
 Table[{data[[i, {1, 2}]], ErrorBar[10*data[[i, 3]]]}, {i, 1, 
   Length[data]}]]

gives
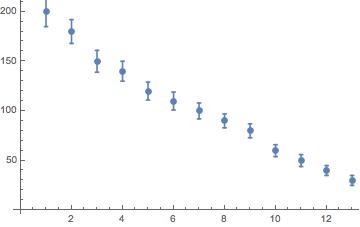
enter image description here

Note that I have multiplied the errors by 10, because they are so small that do not see the bars on the plot if you do not do this.

You can also use functional programming:

ErrorListPlot[Transpose[{data[[All, {1, 2}]], ErrorBar /@ (10*data[[All, 3]])}]]

Cheers, M.

POSTED BY: Marco Thiel
Posted 10 years ago

Thank you!

POSTED BY: Sarmed Hussain
Posted 10 years ago

Thank you very much Marco, but I have another question: How can I use the function Y(A,B,x)=Aexp(B*x) as a fit-function and determine the parameteres A and B?

POSTED BY: Sarmed Hussain

Like so:

fit = NonlinearModelFit[data[[All, {1, 2}]], a*Exp[b x], {a, b}, x]

For the data at hand this gives you a=231.454 and b=-0.13052. You can display the function:

Normal[fit]

If you want to plot everything use:

Needs["ErrorBarPlots`"];
  Show[Plot[Normal[fit], {x, 0, 13}, PlotStyle-> Red], ErrorListPlot[Table[{data[[i, {1, 2}]], ErrorBar[10*data[[i, 3]]]}, {i, 1, Length[data]}]]]

which gives

enter image description here

You might also want to plot the 99% confidence bands like so:

Show[Plot[{Normal[fit], fit["MeanPredictionBands", ConfidenceLevel -> .99]}, {x, 0, 13}, PlotStyle -> Red, Filling -> {2 -> {1}}], 
 ErrorListPlot[Table[{data[[i, {1, 2}]], ErrorBar[10*data[[i, 3]]]}, {i, 1, Length[data]}]]]

That gives

enter image description here

This fit does not take the errors into consideration. If you want to do that you might have to attach weights to the data points.

Cheers, Marco

POSTED BY: Marco Thiel

Ok, for the sake of completeness, if you want to use the information of the errors for the fit this will do the trick:

fit = NonlinearModelFit[data[[All, {1, 2}]], a*Exp[b x], {a, b}, x, Weights -> 1/data[[All, 3]]^2]

which gives $a=241.238$ and $b=-0.138946$.If you then plot:

Show[Plot[{Normal[fit], fit["MeanPredictionBands", ConfidenceLevel -> .99]}, {x, 0, 13}, PlotStyle -> Red, Filling -> {2 -> {1}}], ErrorListPlot[Table[{data[[i, {1, 2}]], ErrorBar[10*data[[i, 3]]]}, {i, 1, Length[data]}]]]

enter image description here

Cheers, Marco

POSTED BY: Marco Thiel
Posted 10 years ago

Thank you for your help! Maybe one last question: What does mathematically happen when you use Wheights -> 1/data[[All,3]^2]?

POSTED BY: Sarmed Hussain

You need to read up on BLUE (best linear unbiased estimator). See for example http://en.wikipedia.org/wiki/Least_squares the bit on weighted least squares. You can search for the "Aitken" on that website.

Also, see

http://reference.wolfram.com/applications/eda/FittingDataToLinearModelsByLeast-SquaresTechniques.html

Cheers, Marco

POSTED BY: Marco Thiel
Posted 10 years ago

Thank you :)

POSTED BY: Sarmed Hussain
Reply to this discussion
Community posts can be styled and formatted using the Markdown syntax.
Reply Preview
Attachments
Remove
or Discard

Group Abstract Group Abstract