Good Morning , I am new in this community and I hope I am writting in the rightsections. This is my question. I have created two arrays
 datF1 = Table[   1/(Sqrt[2*Pi] *t)  Exp[(-0.5*(Log[t] - 1)^2)], {t, 0.001, 30,    0.01}];
 datF2 = Table[   1/(Sqrt[2*Pi] *t)  Exp[(-0.5*(Log[t] - 0.01)^2)] {t, 0.001, 30,   0.01}];
Where datF1 and datF2 represents the samples of a lognormal r.v from to 30 , so 3000 samples.
Then I have applied the FFT
F1 = Fourier[datF1];
F2 = Fourier[datF2];
... defined F3 = F1*F2 and applied the InverseFourier
datF3 = InverseFourier[F3];
And plotted datF3 using the ListPlot[] functions obtaining this :
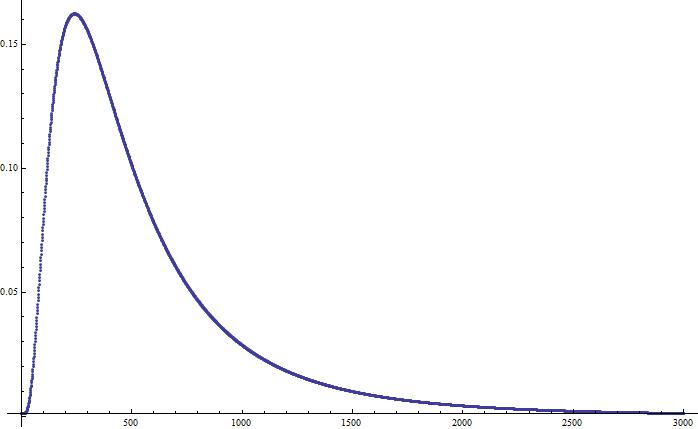
And this is what I wanted, but I want rescale the x-axis. I would pass from a x-axis with a scale representing the number of points od the array, to a scale in t domain. Do you know if is it possible ? Do I have to change any functions used ? Other ?
Thank you in advance,
Stefano


