Message Boards Message Boards

0
|
9104 Views
|
3 Replies
|
0 Total Likes
View groups...
Share
Share this post:

FFT - InverseFourier[] - ListPlot

Posted 10 years ago

Good Morning , I am new in this community and I hope I am writting in the rightsections. This is my question. I have created two arrays

 datF1 = Table[   1/(Sqrt[2*Pi] *t)  Exp[(-0.5*(Log[t] - 1)^2)], {t, 0.001, 30,    0.01}];     
 datF2 = Table[   1/(Sqrt[2*Pi] *t)  Exp[(-0.5*(Log[t] - 0.01)^2)] {t, 0.001, 30,   0.01}];

Where datF1 and datF2 represents the samples of a lognormal r.v from to 30 , so 3000 samples.

Then I have applied the FFT

F1 = Fourier[datF1];
F2 = Fourier[datF2];

... defined F3 = F1*F2 and applied the InverseFourier

datF3 = InverseFourier[F3];

And plotted datF3 using the ListPlot[] functions obtaining this :
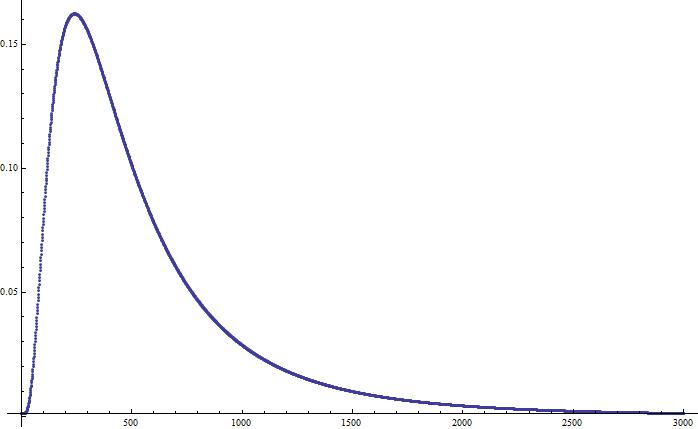
enter image description here

And this is what I wanted, but I want rescale the x-axis. I would pass from a x-axis with a scale representing the number of points od the array, to a scale in t domain. Do you know if is it possible ? Do I have to change any functions used ? Other ?

Thank you in advance,

Stefano

POSTED BY: Stefano Pavinato
3 Replies

Hi,

Probably, what you need can be done with ListPlot[] options, but brute force solution may look like this:

ListPlot[Transpose[Join[{Range[30./3000.,30.,30./3000.]},{datF3}]]]

or

 ListPlot[MapThread[List,{Range[30./3000.,30.,30./3000.],datF3}]]

I.M.

POSTED BY: Ivan Morozov
Posted 10 years ago

... And this is what I wanted, but I want rescale the x-axis.

Would this general idea help?

r=Range[0,5]

{0,1,2,3,4,5}

30*Rescale[r]

{0,6,12,18,24,30}

POSTED BY: Dana DeLouis
Posted 10 years ago

Ivan Morozov is directly generating the list of times associated with the 3000x1 list, so you just need to ListPlot the 3000x2 list he calculated. The x axis values are now the times, and the x-axis scale will be in time, not index. Since you've done a Fourier and and InverseFourier, these are the original times, so you could also use this:

times = Table[t, {t, 0.001, 30, 0.01}];

ListPlot[{times, datF3} // Transpose]

You could also use

ListPlot[datF3, DataRange -> {0.001, 30}]
POSTED BY: David Keith
Reply to this discussion
Community posts can be styled and formatted using the Markdown syntax.
Reply Preview
Attachments
Remove
or Discard

Group Abstract Group Abstract