I noticed that all important "Geoprojections" are available in projections for spherical reference models: GeoProjectionData function.
1 - How can I use the sinusoidal projection using astronomical data ? I want to use the frames of this projection to plot astronomical points in that map , using right ascension and declination as the coordinates, both in degrees.
2 - And what about the Hammer-Aitoff Equal-Area Projection? If that projection is not available, how do I make an astronomical plot using the equations ( also doing ticks, axis, frames, etc..)?
In the link below is data that can be used. The format is { {RA,DEC, Velocity},....}. Just need the RA, DEC parameters.
So DataSample
EDIT 1:
I did some tries, after reading maps and cartographies from Wolfram help:
> GeoGraphics[{}, GeoRange -> All, GeoProjection -> "Sinusoidal",
> GeoGridLines -> Automatic,   GeoGridLinesStyle -> Directive[Thin,
> Dashed, Yellow],   GeoBackground -> Black, Frame -> True]
And the result is:
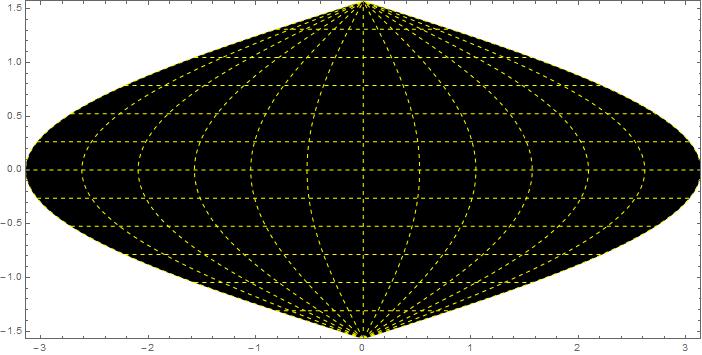
But I need to insert the point data and make the coordinates range going -90 to 90 and 0 to 360
And one more challenge, I want to use a color range for every point using the parameter (Velocity). Is that possible?
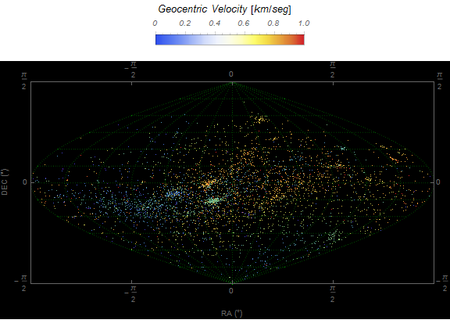
EDIT 2:
Thanks to bbgodfrey, we did this (http://mathematica.stackexchange.com/questions/72426/using-map-projections-with-astronomical-data):
Wolfram developers, don t you think it is time to create specific plotting functions for the astronomy area?


