Message Boards Message Boards

20
|
49847 Views
|
28 Replies
|
35 Total Likes
View groups...
Share
Share this post:

Crystallica: A package to plot crystal structures

General information and download links

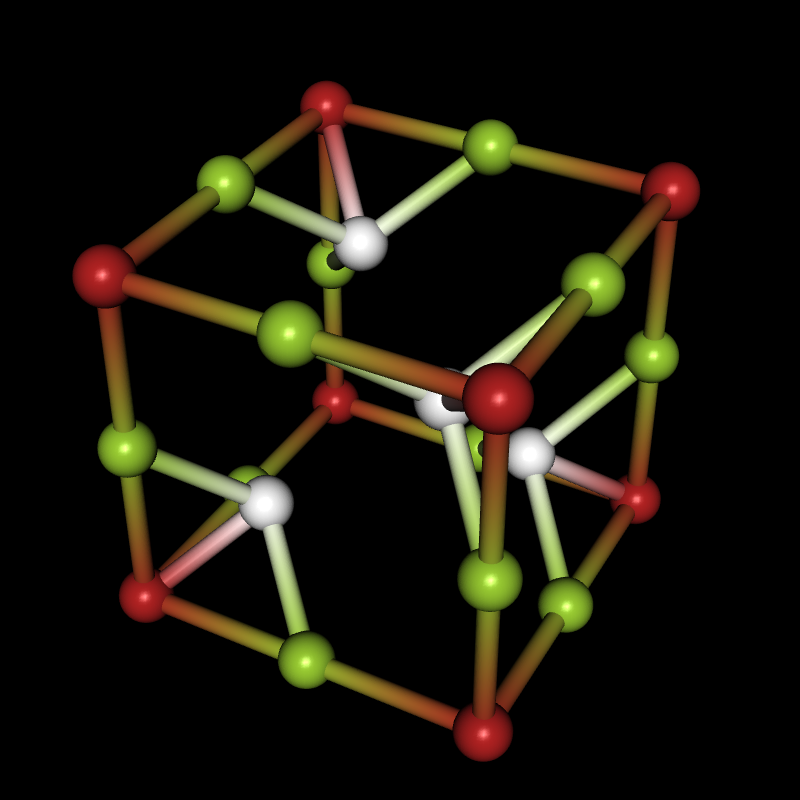
If you're interested in crystal structures, you can now download the Crystallica application from the Wolfram Library Archive, and then you can do things like this:

Needs["Crystallica`"];
CrystalPlot[
{{5.4,0,0},{0,5.4,0},{0,0,5.4}},
{{0,0,0},{0,0,.5},{0,.5,0},{.5,0,0},{.24,.24,.24},{.24,.76,.76},{.76,.24,.76},{.76,.76,.24}},
{1,2,2,2,3,3,3,3},
AtomCol->{"Firebrick","YellowGreen",White},AtomRad->.4,
BondStyle->2,BondDist->3,
CellLineStyle->False,AddQ->True,Lighting->{{"Directional",White,ImageScaled[{0,0,1}]}},Background->Black]
enter image description here

Here are the download links for Crystallica and two other packages you may need:

Crystallica - contains the functions CrystalPlot and CrystalChange

CifImport - contains an import function for CIF files

VaspImport - contains an import function for files related to VASP

Once you've installed Crystallica (by saving the entire Crystallica folder - not the zip archive - to $USerBaseDirectory/Applications and re-starting the Kernel), you can enter Crystallica into the Documentation Center and you'll find lots of useful examples. Most of the examples in this post are taken from the Documentation. For the other two packages, just install them and evaluate this:

?CifImport
?VaspImport

I'll first show you a few things the CrystalPlot function can do when you already have crystal structure data inside Mathematica, wherever it may have come from. Then we'll take a look at how to get the data into Mathematica in the first place, which is where CifImport and VaspImport will come into play - but we'll get data from other sources as well. I'll cover the different import solutions in separate replies to this thread, because I have a feeling that I'll be rambling on and on and on...

Simple plot

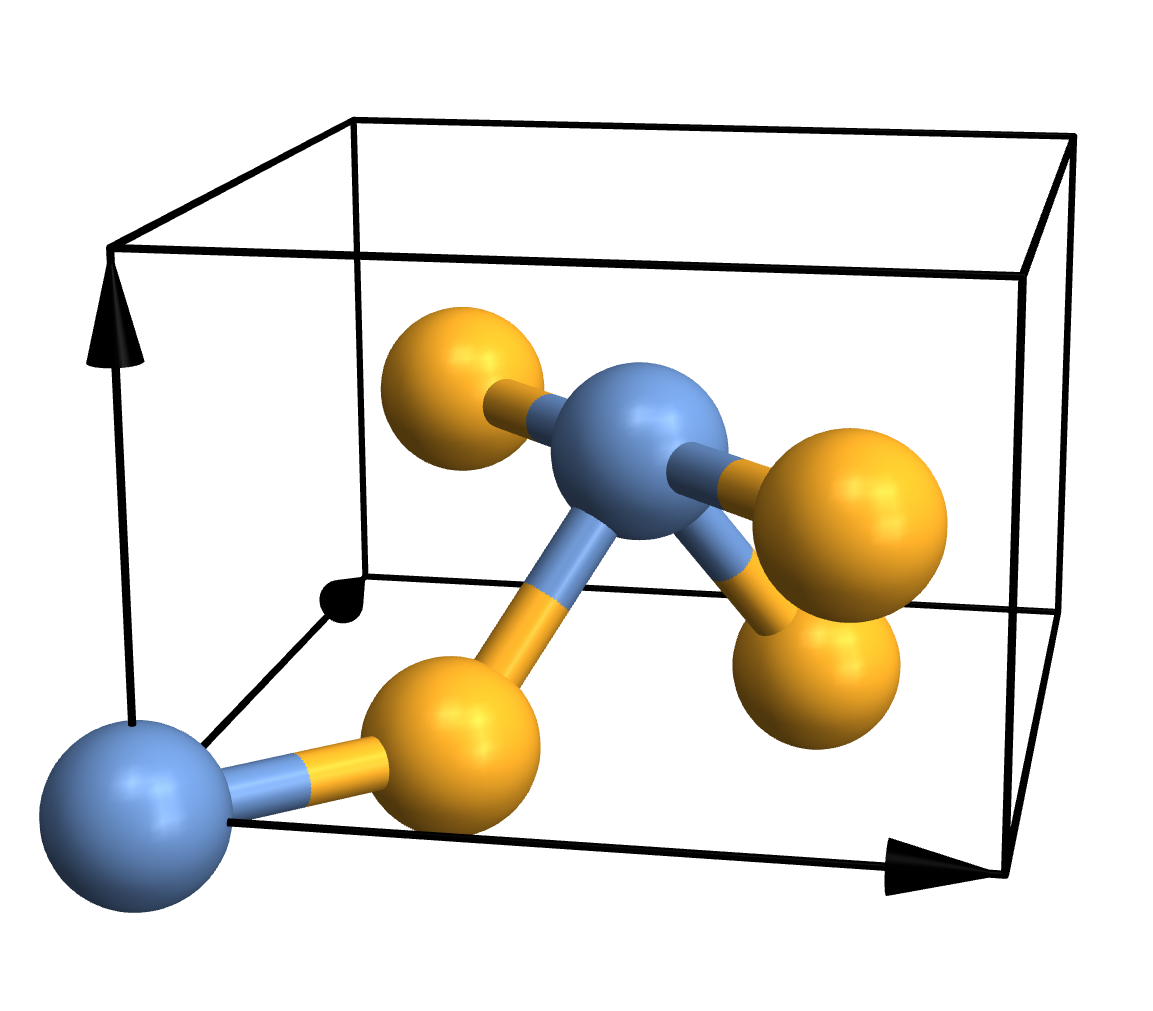
Traditional ball-and-stick plots are usually just fine, so the simplest thing you can do is this:

CrystalPlot[
{{4.5,0,0},{0,4.5,0},{0,0,3}},
{{0,0,0},{.5,.5,.5},{.2,.8,.5},{.3,.3,0},{.7,.7,0},{.8,.2,.5}},
{1,1,2,2,2,2}]
enter image description here

As you can see, CrystalPlot expects three arguments. The first one contains the lattice vectors, which are simply the three vectors that create the parallelepiped that constitutes the cell. The second argument contains the atomic coordinates, but they're given in the basis of the lattice vectors (which is quite useful in crystallography). The third argument is a list of integers that gives the atom types, with one entry for each atom. If you want to plot a molecule instead, you can call CrystalPlot with just two arguments: A list of atom coordinates in cartesian space, and a list of atom types. Everything else you see in the plot - the atoms, bonds, colours, arrows etc. - represents the default settings of various layout options.

Advanced atoms and bonds

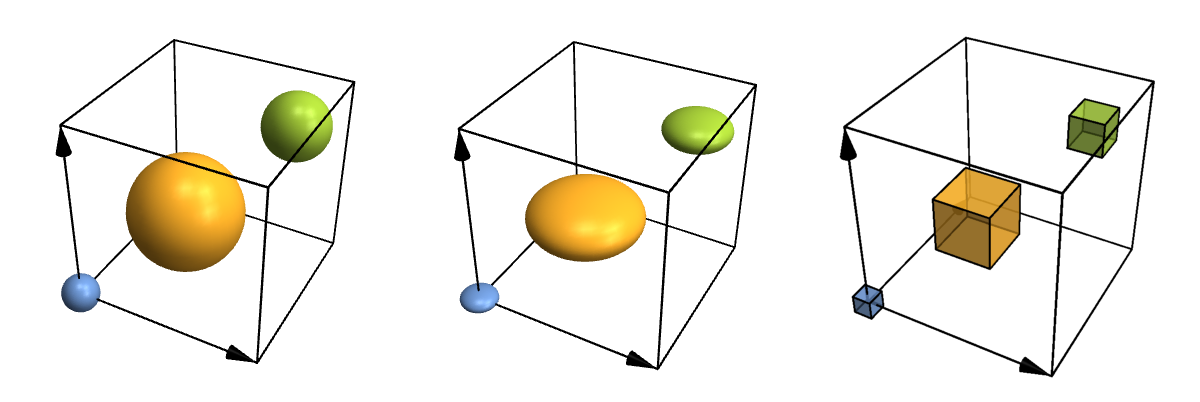
Let's take a look at some more advanced options just for fun. For instance, atoms and bonds can look any way you need them to, because you can specify your own functions for them. You can also fine-tune where to put bonds and what to do with their thickness and colour in a physically (or chemically) meaningful way, but I won't show that here. So here are some customized atoms and bonds:

Row[Table[
CrystalPlot[{{4,0,0},{0,4,0},{0,0,4}},{{0,0,0},{.4,.4,.4},{.8,.8,.8}},{1,2,3},
AtomRad->{.4,1.2,.7},AtomFunction->style,ImageSize->400],
{style,{
(Ball[#1,#2]&),
(Scale[Sphere[#1,#2],{1,1,.5}]&),
({EdgeForm[Thick],Opacity[.7],Cuboid[#1-.5*#2,#1+.5*#2]}&)
}}]]
enter image description here

Row[Table[
CrystalPlot[{{0,0,0},{5,0,0},{2.5,4,0}},{1,2,3},BondDist->6,BondStyle->style,ImageSize->400],
{style,{
1,
Function[{bonds,partcol},Table[{If[ii<.5,partcol[#,1],partcol[#,2]],Sphere[bonds[[#,1]]+ii*(bonds[[#,2]]-bonds[[#,1]]),.15]},{ii,0,1,1/9}]&/@Range[Length[bonds]]],
Function[{bonds,partcol},Module[{spiral,points,rad=.05},
spiral[atoms_]:=Module[{scale=.5,dist=atoms[[2]]-atoms[[1]],curls=60,normal,rot,scaled},
normal=Table[{scale*Cos[ii],scale*Sin[ii],.1*ii},{ii,0,curls,\[Pi]/10}];
scaled={#[[1]],#[[2]],10*Norm[dist]/curls*#[[3]]}&/@normal;
rot=scaled.Quiet[RotationMatrix[{dist,{0,0,1}}]];
Join[{atoms[[1]]},#+atoms[[1]]&/@(rot[[25;;-25]]),{atoms[[2]]}]];
points=spiral/@bonds;
{partcol[#,1],Tube[BSplineCurve[points[[#,;;Round[Length[points[[#]]]/2]]],rad]],partcol[#,2],Tube[BSplineCurve[points[[#,Round[Length[points[[#]]]/2];;]],rad]]}&/@Range[Length[bonds]]
]]
}}]]

enter image description here

Lattice planes

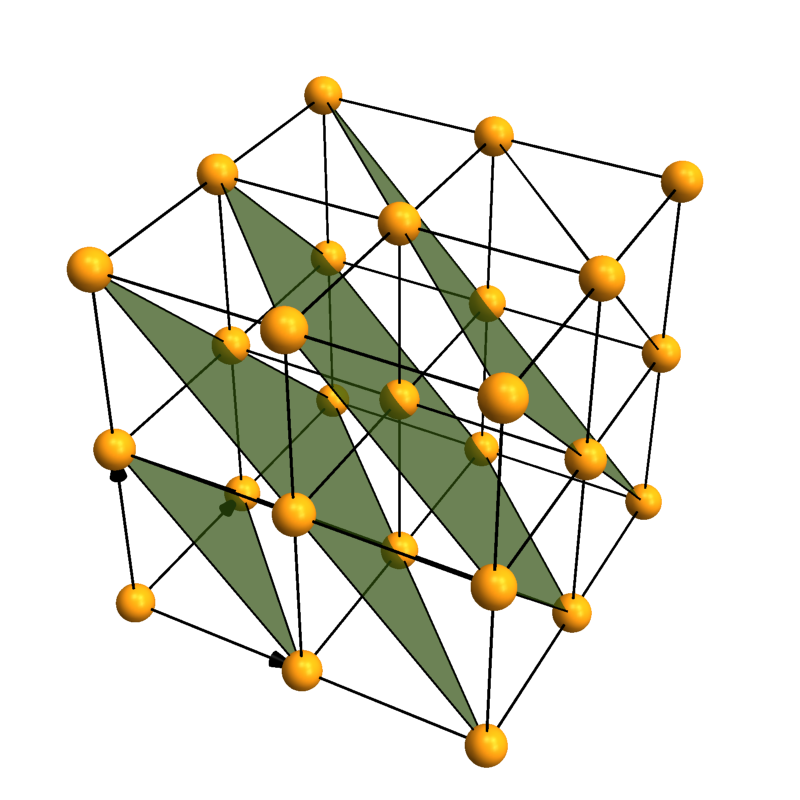
Crystallica can also add lattice planes to the plot. You can specify them using [h,k,l] Miller indices and distance to the origin.

CrystalPlot[{{3,0,0},{0,3,0},{0,0,3}},{{0,0,0}},{1},
AddQ->True,AtomRad->.3,AtomCol->"CadmiumYellow",Sysdim->2,CellLineStyle->2,
LatticePlanes->Table[{{1,1,1},dist},{dist,1,5}],ContourStyle->{"TerreVerte",Opacity[.7]},BoundaryStyle->Thick]
enter image description here

Coordination polyhedra

You can automatically search for and plot coordination polyhedra. This is not limited to the commonly occurring tetrahedra and octahedra - you can actually look for polyhedra with arbitrary numbers of corners. There are also options to fine-tune both the searching and the rendering.

plot[corners_,mixed_]:=CrystalPlot[{{0,0,0},{0,0,1.8},{-.9,-1.5,-.6},{-.9,1.5,-.6},{1.7,0,-.6},{.8,.8,.8}},{1,2,2,2,2,3},
BondStyle->False,ImageSize->250,
PolyMode[corners]->{"Show"->All,"AllowMixed"->mixed},PolyStyle[corners]->Directive[Opacity[.5],EdgeForm[Thick]]];
Grid[{{
"",
"Search for polyhedra with \n4 corners",
"Search for polyhedra with \n5 corners"
},{
"Allow \nmixed corners",
plot[4,True],
plot[5,True]
},{
"Don't allow \nmixed corners",
plot[4,False],
plot[5,False]
}},Dividers->All]
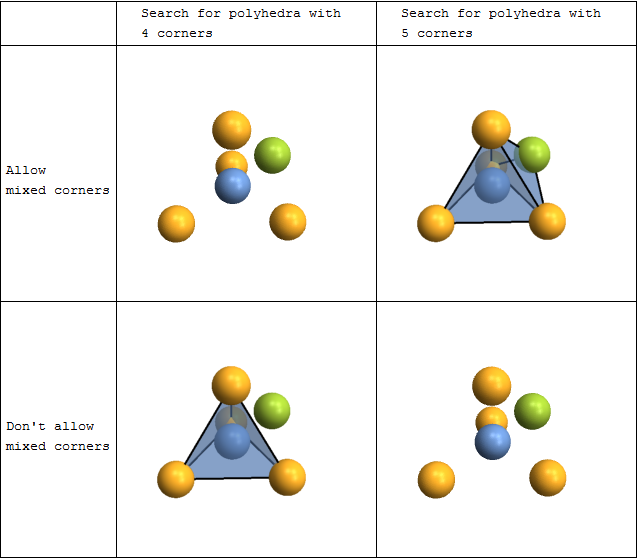
enter image description here

CrystalPlot[{{2.5,-4.3,0},{2.5,4.3,0},{0,0,5.5}},
{{.5,0,0},{0,.5,.7},{.5,.5,.3},{.2,.4,.5},{.6,.8,.2},{.2,.8,.8},{.8,.6,.5},{.4,.2,.2},{.8,.2,.8}},{1,1,1,2,2,2,2,2,2},
PolyMode[4]->True,PolyStyle[4]->EdgeForm[None],AddQ->True,
Sysdim->2,AtomRad->0,CellLineStyle->False,AtomCol->{"SlateGray","Firebrick"},
ViewAngle->.4,ViewPoint->{3.2,0,1.1},ViewVertical->{.5,0,1.2}]
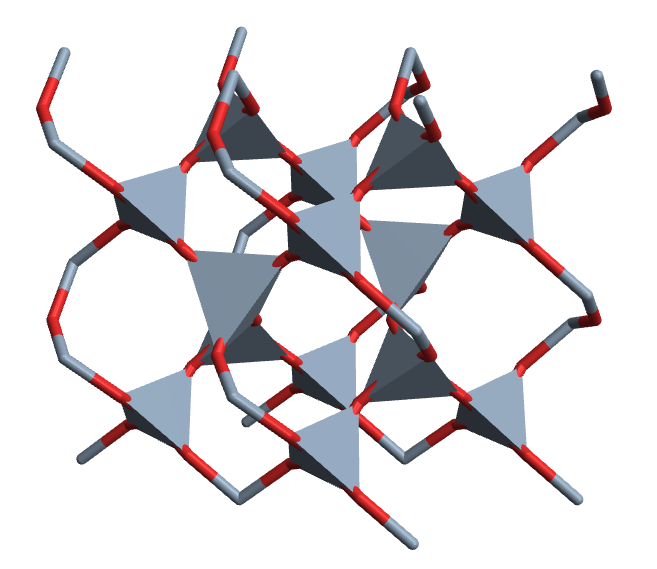
enter image description here

Other things

Visualization aside, you can also build supercells, change cell shapes, or add, remove and sort atoms... but that's a bit boring to read, so I'll refer you to the Documentation page of the CrystalChange function instead.

If you're interested, we can use this thread to talk about any questions you may have, or you can share your use of the package (if you decide to use it). I'm not offering full support here, but I'll be floating around, and I'd like to hear your feedback. We don't have any intentions to be involved in further development. But if you have a good idea and some time, then by all means, work on it for yourself, or host it on your favourite code collaboration site.

Bianca Eifert and Christian Heiliger

POSTED BY: Bianca Eifert
28 Replies

Hi everyone, and thanks to all of you who are still using Crystallica so many years later! I'm happy you've found it useful. This reply is for everyone who had problems with lattice planes in Mathematica 12, and I'm very sorry I haven't been able to react sooner. There was indeed a change in Mathematica that broke my code. Here's a fix you can make yourself:

  1. Find and open the file Crystallica/PackageFiles/CrystalPlot.m within your Crystallica installation.
  2. Find the following section of code:

    (*lattice planes: *)
    
    If[p3dQ||d2Q,
    oneplane[{h_,k_,l___},dist_]:=Cases[ContourPlot[{h,k}.{x,y}==dist,{x,0,sysdim[[1]]},{y,0,sysdim[[2]]},
    Evaluate[Sequence@@Join[FilterRules[options,Options[ContourPlot]],{Mesh->False,ContourLabels->False,ContourStyle->{Thick,Red}}]]],GraphicsComplex[x_,y__]:>GraphicsComplex[If[p3dQ,Join[#,{0}]&/@(x.lattvec[[{1,2},{1,2}]]),x.lattvec],y]],
    oneplane[{h_,k_,l_},dist_]:=Cases[ContourPlot3D[{h,k,l}.{x,y,z}==dist,{x,0,sysdim[[1]]},{y,0,sysdim[[2]]},{z,0,sysdim[[3]]},
    Evaluate[Sequence@@Join[FilterRules[options,Options[ContourPlot3D]],{Mesh->False,BoundaryStyle->None,ContourStyle->{Red,Opacity[.5]}}]]],GraphicsComplex[x_,y__]:>GraphicsComplex[x.lattvec,y]]
    ];
    planes=oneplane@@@(LatticePlanes/.options/.Options[CrystalPlot]);
    
  3. Replace it with the following:

    (*lattice planes: *)
    
    If[p3dQ||d2Q,
    oneplane[{h_,k_,l___},dist_]:=Cases[ContourPlot[{h,k}.{x,y}==dist,{x,0,sysdim[[1]]},{y,0,sysdim[[2]]},
    Evaluate[Sequence@@Join[FilterRules[options,Options[ContourPlot]],{Mesh->False,ContourLabels->False,ContourStyle->{Thick,Red}}]]],GraphicsComplex[x_,y__]:>GraphicsComplex[If[p3dQ,Join[#,{0}]&/@(x.lattvec[[{1,2},{1,2}]]),x.lattvec],y],Infinity],
    oneplane[{h_,k_,l_},dist_]:=Cases[ContourPlot3D[{h,k,l}.{x,y,z}==dist,{x,0,sysdim[[1]]},{y,0,sysdim[[2]]},{z,0,sysdim[[3]]},
    Evaluate[Sequence@@Join[FilterRules[options,Options[ContourPlot3D]],{Mesh->False,BoundaryStyle->None,ContourStyle->{Red,Opacity[.5]}}]]],GraphicsComplex[x_,y__]:>GraphicsComplex[x.lattvec,y],Infinity]
    ];
    planes=oneplane@@@(LatticePlanes/.options/.Options[CrystalPlot]);
    

Yes, it's basically just addding two "Infinity"s. Based on a quick test, that should work for both 2D and 3D now.

Sorry again to leave you alone with this. I sadly haven't used Mathematica in a long time myself. I hope this fix still helps someone.

POSTED BY: Bianca Eifert
Posted 4 years ago

LatticePlanes isn't working for me either, even in this simple example:

CrystalPlot[{{3, 0, 0}, {0, 3, 0}, {0, 0, 3}}, LatticePlanes -> {{{1, 1, 1}, 1}}]

hmm.. crystallica-bug

POSTED BY: Sterling Baird

Hello Someone can help me, I try to do something simple and I can't get the dimensions of the stutructure that's going on? When you download the package, save it to a cart then install it by File -> Install -> Crystallica.m which you are doing wrong. enter image description here

Posted 5 years ago

LatticePlanes is not working for me, although other features of CrystalPlot are. I've installed Crystallica in Mathematica 12 under Mac OS 10.12.6 Sierra. Any Idea what's wrong?

Attachments:
POSTED BY: Robert Walgate

Hello Robert. I use Mathematica 12.1 under macOS Catalina ver. 10.15.7. I ran the same codes and got the exact output as yours.

I wonder why... perhaps the codes don't work in Ver. 12?

I also notice the double and triple bond visualization problem has gone in Ver. 12. I tried to run

ChemicalData["Benzene", "MoleculePlot"]

and the output is excellent: we can see the double bond in the benzene. I guess they implemented Bianca's codes in the new version.

Anyway, the VaspImport package is great (even though I use Quantum Espresso for my work.)

Thank you.

POSTED BY: Febdian Rusydi

Hello Bianca,

Thank you so much for developing the Crystallica application. Its really impressive and helpful for me to work on lattice structures of metals. I am using the app to create the Cubic,BCC,FCC and HCP lattices. In them I am creating lattice planes to depict slip planes and slip directions originating from the atoms, using the statement below:

CrystalPlot[{{3, 0, 0}, {0, 3, 0}, {0, 0, 3}}, {{0, 0, 0}}, {1}, 
 AddQ -> True, AtomRad -> .3, AtomCol -> "CadmiumYellow", Sysdim -> 2,
  CellLineStyle -> {3, 3}, LatticePlanes -> {{{1, 1, 1}, 2}}, 
 ContourStyle -> {"TerreVerte", Opacity[.7]}, BoundaryStyle -> Thick, 
 CellLinesAdd -> {"multi", {{{0, 0, 0}, {0, 0, 0}, {-2, 2, 0}}, 9, 
    CellLineCol -> Red, 
    CellLineRad -> {.02, .05}}, {{{0, 0, 0}, {0, 0, 0}, {0, -2, 2}}, 
    13, CellLineCol -> Red, 
    CellLineRad -> {.02, .05}}, {{{0, 0, 0}, {0, 0, 0}, {2, 0, -2}}, 
    19, CellLineCol -> Red, CellLineRad -> {.02, .05}}}, 
 AxesLabel -> {x, y, z}, 
 AtomFunction -> ({Black, Text[Style[ToString[#5], Bold, 16], #], #3, 
     Sphere[#, #2]} &)]

This statement, helps me create a structure close to FCC excluding the central atom. Could you help me out with deleting the central atom so that the lattice structure becomes a perfect FCC structure with the planes and directions shown.

I tried the Reshape command too, however was not successful in generating a structure similar to the one I generating before.

Thank you ~Pawan

POSTED BY: Pawan Chaugule

Welcome to Wolfram Community! Please make sure you know the rules: https://wolfr.am/READ-1ST

The rules explain how to format your code properly. If you do not format code, it may become corrupted and useless to other members. Please EDIT your posts and make sure code blocks start on a new paragraph and look framed and colored like this.

int = Integrate[1/(x^3 - 1), x];
Map[Framed, int, Infinity]

enter image description here

POSTED BY: EDITORIAL BOARD

A quick way to delete the central atom from your plot:

plot = CrystalPlot[ ....];
DeleteCases[plot, Tooltip[_, 8], Infinity]

enter image description here

If you need to renumber the atoms, then you can adjust your AtomFunction to do that. You could also use the AtomFunction to choose not to draw atom 8, by giving it a radius of 0.

POSTED BY: Jason Biggs

Thank you Jason for your swift reply. It was helpful for me. I do have one more issue. I am trying to generate LatticePlanes which pass through the origin. Since the syntax is:

LatticePlanes -> {{h,k},dist}

where dist is the distance of the plane from the origin, how can I plot a Lattice plane which passes through the origin. For eg. LatticePlanes -> {{{1, 1, 0}, 1}} plots a plane intersecting the x and y axes and the command LatticePlanes -> {{{-1, -1, 0}, 1}} should plot the plane perpendicular to the previous one, but it doesn't. I do not know what should give the value of dist in the second case.

POSTED BY: Pawan Chaugule

I tried moving the origin to another co-ordinate so that the dist value doesn't become zero, however I still wasn't able to generate the plane.

POSTED BY: Pawan Chaugule

Bianca, This package looks great! Would you be willing to host it on github, since the Wolfram Library Archive link is not active?

Thanks, Jason

POSTED BY: Jason Biggs

Thanks Jason! Is there anything wrong with the Library Archive link? It seems to work fine for me.

However, I understand that the Library Archive is somewhat static and we're missing out on easy updating and collaboration potential. I've never used github before, but I really just need to make some time and set it up - it's certainly on my list of things to do.

POSTED BY: Bianca Eifert

Bianca - the library link for some reason came up as "item not found" on my work PC, very strange since it works for the guy in the next cubicle and it worked from home. I'll talk to IT about it I guess the first time I checked the link it was down and my browser cached the "Item not found" page. Found it now. Thanks again for working on this!

I'm interested in your code for showing multiple bonds, it's something I think they should implement in Mathematica. I was able to get larger molecules and smaller molecules to work fine, "Benzene" or "N2" for example, but I can't get acetylene to work. I grabbed the graph information from another source and I try to use it via

<< multiBondPlot`;
multiBondPlot`Private`mbp @@ {{{-60., 0., 0.}, {60., 0., 0.}, {-166.5,
     0., -0.01}, {166.5, 0., 0.01}}, {"C", "C", "H", "H"}, {1 -> 2, 
   1 -> 3, 2 -> 4}, {"Triple", "Single", "Single"}}

produces this plot

Mathematica graphics

It isn't plotting the three different tubes for the bond, only one. The one tube it is plotting has been resized as it should have been, but I suspect the other two tubes are plotted right on top of it. Now if I change it so the triple bond is between a carbon and a hydrogen (ignoring everything I learned in genChem), then it works,

multiBondPlot`Private`mbp @@ {{{-60., 0., 0.}, {60., 0., 0.}, {-166.5,
     0., -0.01}, {166.5, 0., 0.01}}, {"C", "C", "H", "H"}, {1 -> 2, 
   1 -> 3, 2 -> 4}, {"Single", "Triple", "Single"}}

Mathematica graphics

I may try to work through the code for shift to see why it has trouble with this, but if you have any ideas that would be most helpful.

Jason

Edit

I figured out what the issue is. The way you determine the direction to offset the tubes is by taking the cross product of two neighboring bond vectors. But if those bonds are parallel, as they are in this linear molecule, then that cross product is zero. I just added a check to see if the dir is zero and if so replace it with the default {0,0,1}.

This fixes the problem above, but it is still a problem if the bond itself lies along the z-axis - since that is what you take the default shift direction to be. So I added another check to see if the bond is along that direction, and then changed the shift to be {0,1,0} only in that case. Here is the modified shift function

shift[bondindex_]:=Module[{thisbond,dir,spacing,defaultdir},
    (*get the bond from the list of bonds: *)

    thisbond=bondlist[[bondindex]];
    (*the shift vector must be perpendicular to the bond itself and to the local molecular plane;
    first, identify neighbours of the bond to establish the local molecular plane: *)
    dir=Select[
        Most /@ Complement[bondlist, {thisbond}],
        Length[Intersection[#, Most @ thisbond]] > 0 &
    ];
    (*Set the default direction to {0,0,1}, unless the bond is oriented in that direction as well *)
    default = If[ Most[ Subtract @@ atomPositions[[Most @ thisbond]] ] == {0.,0.}, {0, 1, 0}, {0, 0, 1}];
    (*... now construct a vector that is perpendicular to that plane and the bond;
    if there aren't enough neighbouring atoms to establish a plane, just assume a fixed vector of in the 
    default direction defined above: *)
    dir=If[Length[dir]<2,
        default,
        (Normalize@*Cross @@ (Subtract @@ atomPositions[[#]] & /@ dir[[;;2]]))/. {0., 0., 0.} -> default
    ];
    (*dir = N[dir]/. {0., 0., 0.} -> {0, 0, 1};*)
    (*fixed parameter for the spacing of the bonds, i.e. how far they are shifted out from the vector connecting the two atoms;
    a value of 7 seems to look good with the chosen atom radii (see "atomplot" above), so that's what we'll use: *)
    spacing=7;
    (*apply the shift: *)
    Last@thisbond spacing*Normalize[Cross[Subtract@@atomPositions[[Most@thisbond]],dir]]
];

Just a quick check to make sure it isn't broken:

<< multiBondPlot`;
multiBondPlot["N2"] // ImageCrop
multiBondPlot["Anthracene"] // ImageCrop
multiBondPlot`Private`mbp @@ {RotateLeft /@ {{-60., 0., 0.}, {60., 0.,
       0.}, {-166.5, 0., 0}, {166.5, 0., 0}}, {"C", "C", "H", 
    "H"}, {1 -> 2, 1 -> 3, 2 -> 4}, {"Triple", "Single", 
    "Single"}} // ImageCrop

Mathematica graphics

POSTED BY: Jason Biggs

Hm, that looks nasty. Your suspicion is correct; if you look at First[] of your output (to get the actual list of sphere and tube objects), you'll see that the bonds are in fact all there, they're just not shifted outwards. The problem with the shift function is the following: We're in the case where there are not enough neighbouring atoms to establish a molecular plane. For this case, I just hardcoded a fixed shifting direction under the assumption that the direction doesn't matter (which it doesn't, because there's no reference plane), but if the whole molecule is aligned the same way already, the shift isn't visible.

Compare these two:

multiBondPlot`Private`mbp[{{-60, 0, 0}, {60, 0, 0}}, {"C","C"}, {1 -> 2}, {"Triple"}]
multiBondPlot`Private`mbp[{{0, 0, -60}, {0, 0, 60}}, {"C","C"}, {1 -> 2}, {"Triple"}]

So... yeah... clearly a bug. Sorry about that. It seems that in the following bit of code in the package:

    (*... now construct a vector that is perpendicular to that plane and the bond;
    if there aren't enough neighbouring atoms to establish a plane, just assume a fixed vector of {0,0,1}: *)
    dir=If[Length[dir]<2,
        {0,0,1},
        Normalize[Cross[Subtract@@atomPositions[[dir[[1]]]],Subtract@@atomPositions[[dir[[2]]]]]]
    ];

... the "then" part of the If needs to be more intelligent. In fact, it would probably need to distinguish between Length[dir] values of 0, 1, 2, and greater than 2, where only the last case currently has a good solution.

I may need to think about the whole shift function some more though because I'm constantly surprised how often it works. But feel free to play around and post any new solutions (multiBondPlot has its own thread here).

Edit: Still haven't looked into making a repo for Crystallica, but my simple single-file packages have a home now if you want to contribute any improvements or if the link problems persist.

Re your edit: Yep, looks like that works. Thank you!

POSTED BY: Bianca Eifert

Just saw that you replied while I was drafting an edit to the post. I came up with a workaround, hope it's robust. Now my next goal is to find someway to download 3D structures for the 33,000 ChemicalData entities we don't have them for. Looking at ServiceConnect for this.....

POSTED BY: Jason Biggs

That would be interesting. I haven't looked at that yet since I don't work with molecules at the moment. Who knows, maybe ChemicalData will be updated now that PubChem is connected...

In case it got lost in the edits, you can contribute to the package if you like, that might finally force me to figure out how git actually works (the initial commit via the github website was just too easy, so no learning happened yet).

POSTED BY: Bianca Eifert

I wish to see this function gets enhanced in Wolfram Alpha in the future.

POSTED BY: Shenghui Yang

That would be cool! I'd also like to see multiple bonds for plots from ChemicalData... all the data is there, and my simple solution for how to orient the bonds in space seems to work (well, it may need more testing just to be sure). A chemist may be able to live with only single bonds because they know what the molecular really looks like, and that bonds are just a model anyway, and that some double bonds are actually there while others delocalize, etc... But for students it's quite confusing to see these two images of the same molecule:

Row[{ChemicalData["Benzene","MoleculePlot"],ChemicalData["Benzene","CHColorStructureDiagram"]}]

enter image description here

POSTED BY: Bianca Eifert

Impressive!

POSTED BY: Sander Huisman

enter image description here - you earned "Featured Contributor" badge, congratulations !

Dear @Bianca Eifert , this is a great post and it has been selected for the curated Staff Picks group. Your profile is now distinguished by a "Featured Contributor" badge and displayed on the "Featured Contributor" board.

POSTED BY: EDITORIAL BOARD

We can also couple Crystallica with chemical table formats; we'll use this MOL file of Caffeine because Caffeine is relevant to my interests. Mathematica can already import files like this natively, so we don't need a whole new import package, just a bit of glue code.

First, let's get the data out of the file using Import. Here are the atom coordinates:

coord=Import["Caffeine.mol","VertexCoordinates"]/100
(*results in this output: *)
{{-3.38`,-1.124`,0.572`},{0.964`,-1.072`,-0.816`},{0.05600000000000001`,0.8520000000000001`,0.392`},{-1.372`,-1.02`,-0.05600000000000001`},{-1.26`,0.256`,0.52`},{-0.304`,-1.68`,-0.716`},{1.136`,0.184`,-0.268`},{0.56`,2.08`,0.824`},{-0.49200000000000005`,-2.816`,-1.208`},{-2.632`,-1.7280000000000002`,-0.004`},{-2.228`,0.7960000000000002`,1.088`},{2.548`,2.972`,0.62`},{2.052`,-1.736`,-1.492`},{-2.48`,-2.724`,0.488`},{-3.008`,-1.9000000000000001`,-1.048`},{2.916`,-1.848`,-0.784`},{2.376`,-1.12`,-2.372`},{1.716`,-2.748`,-1.84`},{-0.148`,3.096`,1.532`},{1.892`,2.116`,0.41600000000000004`},{2.284`,0.996`,-0.244`},{-0.168`,4.04`,0.9280000000000002`},{0.352`,3.296`,2.516`},{-1.204`,2.752`,1.72`}}

I divided the coordinates by 100 because MOL files are generally in picometers, while Crystallica works best with Angstrom.

Now we need the atom types:

chem=Import["Caffeine.mol","VertexTypes"]
(*output: *)
{"H","N","C","N","C","C","C","N","O","C","O","H","C","H","H","H","H","H","C","C","N","H","H","H"}

Hm, well, okay, but we need integers. Here's a clunky piece of code that converts our list of types:

conf=ReplacePart[chem,Flatten@Table[#->ii&/@(Flatten@Position[chem,DeleteDuplicates[chem][[ii]]]),{ii,1,Length@DeleteDuplicates[chem]}]]
(*output: *)
{1,2,3,2,3,3,3,2,4,3,4,1,3,1,1,1,1,1,3,3,2,1,1,1}

(Please, if anyone has a prettier solution, tell me!)

But the chemical species might actually also be useful (Crystallica can use them as atom colours), so let's make a list of all unique species in the molecule:

chem=DeleteDuplicates[chem]
(*output: *)
{"H","N","C","O"}

Now let's make a plot!

Needs["Crystallica`"];
CrystalPlot[coord,conf,AtomCol->chem,BondDist->1.7]

enter image description here

If you don't really need any features of Crystallica and your molecule is in ChemicalData anyway, you can also use this:

ChemicalData["Caffeine","MoleculePlot"]

And if you're interested in chemically correct multiple bonds, you may enjoy my Demonstration about multiple bonds.

Other chemical table formats like BRK, ENT, PDB, XYZ, MOL2 and SDF work similarly, and some of them can even store multiple structures. Mathematica can of course also export to these formats. You can also get data from ChemicalData in a similar fashion, but be careful: Some molecules are stored in 2D, even if they're not flat, so for instance ChemicalData["Caffeine","VertexCoordinates"] is not useful for this particular application.

POSTED BY: Bianca Eifert

I would replace your long line:

conf=ReplacePart[chem,Flatten@Table[#->ii&/@(Flatten@Position[chem,DeleteDuplicates[chem][[ii]]]),{ii,1,Length@DeleteDuplicates[chem]}]]

with something like:

types = DeleteDuplicates[chem];
conf = chem /. Thread[types -> Range[Length[types]]]

or as a single line:

conf = chem /. Thread[# -> Range[Length[#]]] &[DeleteDuplicates[chem]]
POSTED BY: Sander Huisman

Or, if you want to live dangerously:

conf=chem/.Thread[(types=DeleteDuplicates[chem])->Range[Length[types]]]
POSTED BY: Sander Huisman

Ah yes, that is indeed so much easier to read, thank you!

(I grabbed my nasty line from a package I wrote years ago and never looked at again because it worked... You know how that goes!)

POSTED BY: Bianca Eifert

That happens, sometimes a much easier solution is possible, but you just don't see it somehow. Possibly one of the shortest (but not best) solution is:

conf = chem /. (# -> ++i & /@ (i = 0; DeleteDuplicates[chem]))
POSTED BY: Sander Huisman

That's actually really nice, hehe...

POSTED BY: Bianca Eifert

You can also import structures from files related to the VASP program.

I'll use the POSCAR of BN from the official VASP site - the second one on the page (although either one will work). Just copy the data to a plain text file and name it "POSCAR". We'll import it with the VaspImport package.

The VASP formats are obviously useful for you if you work with the VASP program, but even if you don't, you may want to use these files: Many other crystal structure programs can import and export them, so you can now exchange data easily between Crystallica and other applications. Also, the POSCAR format in particular is easy to export (I'll show that later), and comfortably readable for a human.

The VaspImport package can read various types of VASP input and output files, namely CONTCAR / POSCAR, OUTCAR, XDATCAR, and vasprun.xml. CONTCAR and POSCAR are essentially the same format and this will be our test case for import and export. These files store one crystal structure. The other three file types can store multiple structures and lots of other information. What exactly these multiple structures are will obviously depend on the type of calculation you did. They might be steps of a structural relaxation or a molecular dynamics run. VaspImport automatically detects the file type and returns all structures in the file, but as for CIF, the last one is usually the one we want.

Let's import our POSCAR:

Get["VaspImport`"];
VaspImport["POSCAR"]

... which returns:

{<|"lattice"->{{0.`,1.785`,1.785`},{1.785`,0.`,1.785`},{1.785`,1.785`,0.`}},"atomcoords"->{{0.`,0.`,0.`},{0.25`,0.25`,0.25`}},
"atomtypes"->{1,2},"chemical"->{},"name"->"Cubic BN","file"->"E:\\POSCAR"|>}

VaspImport always returns a list of structures so that you can consistently work with Last[VaspImport[...]] without thinking about the file type.

We can also connect VaspImport to Crystallica the same way we did for CifImport:

Needs["Crystallica`"];
Needs["VaspImport`"];
vaspPlot[file_,options___]:=With[{data=Last[VaspImport[file]]},
CrystalPlot[data["lattice"],data["atomcoords"],data["atomtypes"],options,AtomCol->data["chemical"]]];
vaspPlot["POSCAR",AtomCol->{"B","N"}]

(I added atom colours because this specific POSCAR doesn't contain chemical atom types; but in general, many files will contain types.)

enter image description here

If you had a file with multiple structures you could do fun things like animations, and you might learn a lot about the process you were simulating.

Alright, so let's take a look at exporting to POSCAR since I promised that it's so easy and useful. As you may have noticed from the VASP documentation, POSCARs can look differently depending on your needs and preferences; they can store cartesian coordinates, or you can scale lattice vectors by giving a total colume for the cell. We'll just go with a very basic export here:

vaspExport[file_,lattvec_,coord_,conf_,chem_,name_]:=Module[{sorted,content},
(*atoms have to be sorted by type: *)
sorted=CrystalChange[lattvec,coord,conf,SortQ->"weak"];
(*export the file: *)
Export[file,Join[
{StringSplit[name],{1.0}},
sorted[[1]],
{chem,Tally[sorted[[3]]][[All,2]],{"Direct"}},
sorted[[2]]
],"Table","FieldSeparators"->" "]
];

And here's a usage example:

vaspExport["myPOSCAR",3*IdentityMatrix[3],{{0,0,0},{.5,.5,.5}},{1,2},{"Cu","O"},"definitely not copper oxide"]

That works, but there's one little problem that some of you may have (I know I do): Maybe you actually want to run the POSCAR through VASP on a Linux cluster, but you use a different OS to prepare the POSCAR. Let me just tell you that Fortran won't enjoy the wrong linebreaks! So here's a version of the export that enforces Unix-style linebreaks. It's an ugly kludge, but for some reason I haven't found a more natural solution. If anyone knows the hidden export option that would do the same, please do let me know.

vaspExport[file_,lattvec_,coord_,conf_,chem_,name_]:=Module[{sorted,content},
(*atoms have to be sorted by type: *)
sorted=CrystalChange[lattvec,coord,conf,SortQ->"weak"];
(*the actual file contents: *)
content=Join[
{StringSplit[name],{1.0}},
sorted[[1]],
{chem,Tally[sorted[[3]]][[All,2]],{"Direct"}},
sorted[[2]]
];
(*convert to UNIX linebreaks (LF): *)
content=ToCharacterCode[ExportString[content,"Table","FieldSeparators"->" "]];
content=If[MemberQ[content,10],(*from LFCR or CRLF: *)DeleteCases[content,13],(*from CR: *)content/.{13->10}];
(*export: *)
Export[file,content,"Binary"]
];

And that's it for VASP import/export!

POSTED BY: Bianca Eifert

This reply is about importing structures from CIF files.

I'll be using this CIF file of Rutile as an example and of course the CifImport package for import. But you will NEED to add something to the end of the CIF file. The last line is currently this: O 0.30530 0.30530 0.00000 You can just type "end" into the following line, or anything else you like; even an additional blank line will help. I'm sorry about this, it's a glitch in the way Import reads the file, so from my end, it could only be fixed by reading the file as a plain table instead.

CIF files are widely used for crystal structures, so if you're looking for a structure, you can usually find a CIF in a database somewhere. But you will see that the crystal structure in a CIF file is impossible to read for most humans, and not entirely trivial to import either. Exporting to CIF also requires extra work that is outside the scope of my packages. On the other hand, CIF files contain lots of metadata such as symmetry properties of the structure, information about the samples themselves, and citation information.

CIF is essentially a markup format where you have a name for each dataset and then the actual data. Mathematica can import our example CIF file and will return a list of rules linking the names and data of each dataset:

Import["Rutile.cif"]

So why do I keep saying that CIF files are not so trivial? Well, let's look at the actual file. You can open it in a text editor or via FilePrint.

Roughly the first half of the file is nicely readable for a human, you get citation information with journal and author names and years and pages and whatnot. Sometimes you'll get information on where the sample was found, or how it was synthesized. Then you get the lattice vectors in terms of their lengths and angles, and the space group. All of that is fine and great to have. But the actual crystal structure data is not so easy, look at this:

loop_
_space _group _symop _operation _xyz
  'x,y,z'
  '-y,-x,z'
  'y,x,-z'
  '1/2+y,1/2-x,1/2-z'
  '1/2-y,1/2+x,1/2+z'
  '1/2+x,1/2-y,1/2+z'
  '1/2-x,1/2+y,1/2-z'
  'x,y,-z'
  '-x,-y,z'
  'y,x,z'
  '-y,-x,-z'
  '1/2-y,1/2+x,1/2-z'
  '1/2+y,1/2-x,1/2+z'
  '1/2-x,1/2+y,1/2+z'
  '1/2+x,1/2-y,1/2-z'
  '-x,-y,-z'
loop_
_atom _site _label
_atom _site _fract _x
_atom _site _fract _y
_atom _site _fract _z
Ti   0.00000   0.00000   0.00000
O   0.30530   0.30530   0.00000

Spoiler alert: This structure, rutile, has 2 Ti and 4 O atoms, and it's a popular crystallization choice among metal dioxides. But the "atom_site" datasets only give us one atom of each type! What's going on here? Is it alchemy? Well, not quite. In addition to these 2 atoms, we also get all symmetry operations of the cell. If we assume for a moment that we have the complete cell with all 6 atoms, we could apply any of these symmetry transformations and we'd end up with the same structure. Atoms would be mapped onto other atoms of the same type. Back to our 2 atoms in the file: If we apply all symmetry operations to these 2 atoms, we will sometimes map them onto themselves, but at other times they will wind up on the positions of their missing friends. And this is how we can construct the complete crystal structure from a CIF file.

So let's import the structure "properly", with CifImport:

Needs["CifImport`"];
CifImport["Rutile.cif"]

... which gives us the following output:

{
<|"lattice"->{{4.59373`,0,0},{0,4.59373`,0},{0,0,2.95812`}},"atomcoords"->{{0.`,0.`,0.`},{0.3053`,0.3053`,0.`}},"atomtypes"->{1,2},"chemical"->{"Ti","O"},"name"->"Rutile","file"->"E:\\Rutile.cif","comment"->"atoms of the asymmetric unit with NONchemical types"|>,
<|"lattice"->{{4.59373`,0,0},{0,4.59373`,0},{0,0,2.95812`}},"atomcoords"->{{0.`,0.`,0.`},{0.5`,0.5`,0.5`},{0.30529999999999996`,0.30529999999999996`,0.`},{0.6947000000000001`,0.6947000000000001`,0.`},{0.8053`,0.19469999999999998`,0.5`},{0.19469999999999998`,0.8053`,0.5`}},"atomtypes"->{1,1,2,2,2,2},"chemical"->{"Ti","O"},"name"->"Rutile","file"->"E:\\Rutile.cif","comment"->"complete cell with chemical types"|>,
<|"lattice"->{{4.59373`,0,0},{0,4.59373`,0},{0,0,2.95812`}},"atomcoords"->{{0.`,0.`,0.`},{0.3053`,0.3053`,0.`}},"atomtypes"->{1,2},"chemical"->{"Ti","O"},"name"->"Rutile","file"->"E:\\Rutile.cif","comment"->"atoms of the asymmetric unit with chemical types"|>,
<|"lattice"->{{4.59373`,0,0},{0,4.59373`,0},{0,0,2.95812`}},"atomcoords"->{{0.`,0.`,0.`},{0.5`,0.5`,0.5`},{0.30529999999999996`,0.30529999999999996`,0.`},{0.6947000000000001`,0.6947000000000001`,0.`},{0.8053`,0.19469999999999998`,0.5`},{0.19469999999999998`,0.8053`,0.5`}},"atomtypes"->{1,1,2,2,2,2},"chemical"->{"Ti","O"},"name"->"Rutile","file"->"E:\\Rutile.cif","comment"->"complete cell with chemical types"|>
}

We get a list of Associations, where each Association represents one crystal structure. Why are there multiple structures? Well, read the "comment" entries: CifImport will give you the complete structure, but also the structure recorded in the file (which is sometimes called an asymmetric unit cell). Also, some structures need multiple atoms of the same type even within the asymmetric unit, and CIF files usually tag these atoms with labels that are suddenly no longer just the chemical species - so that's where the "nonchemical types" come in.

The structure you'll usually be interested in is the last one, which has all the atoms and chemical types. Let's just hook up the import with Crystallica really quickly:

Needs["Crystallica`"];
Needs["CifImport`"];
cifPlot[file_,options___]:=With[{data=Last[CifImport[file]]},
CrystalPlot[data["lattice"],data["atomcoords"],data["atomtypes"],options,AtomCol->data["chemical"]]];
cifPlot["Rutile.cif"]

And we get a plot!

enter image description here

If you wanted to export a structure to CIF format, you would definitely need code that finds the symmetries of your structure, and that can also return the actual name of the space group. You can write that, but you will find that various programs already exist that can export to CIF format, so you might be better off using one of those instead.

POSTED BY: Bianca Eifert
Reply to this discussion
Community posts can be styled and formatted using the Markdown syntax.
Reply Preview
Attachments
Remove
or Discard

Group Abstract Group Abstract