Message Boards Message Boards

0
|
10661 Views
|
5 Replies
|
1 Total Likes
View groups...
Share
Share this post:

Add a fill or background between gridlines in a plot?

Posted 7 years ago

Hello everyone,

How can I add a transparent fill or background between two horizontal gridlines in a plot, in this case, a date list plot? The attached file contains an example.

Greg

How can I add a transparent fill or background between the horizontal \ gridlines located at 100 and 140?

data={
{"Mon 23 Jan 2017 12:41 PM",152},{"Mon 23 Jan 2017 12:44 PM",146},{"Mon 23 Jan 2017 6:11 PM",143},
{"Mon 23 Jan 2017 6:14 PM",142},{"Tue 24 Jan 2017 5:47 PM",135},{"Tue 24 Jan 2017 5:51 PM",126},
{"Wed 25 Jan 2017 6:22 PM",129},{"Wed 25 Jan 2017 6:22 PM",109},{"Thu 26 Jan 2017 12:47 PM",137},
{"Thu 26 Jan 2017 12:49 PM",132},{"Thu 26 Jan 2017 6:36 PM",141},{"Thu 26 Jan 2017 6:39 PM",136},
{"Fri 27 Jan 2017 6:09 PM",122},{"Fri 27 Jan 2017 6:12 PM",116},{"Sat 28 Jan 2017 1:08 PM",116},
{"Sat 28 Jan 2017 1:10 PM",121},{"Sat 28 Jan 2017 7:51 PM",120},{"Sat 28 Jan 2017 7:54 PM",115},
{"Mon 30 Jan 2017 12:50 PM",134},{"Mon 30 Jan 2017 12:53 PM",128},{"Mon 30 Jan 2017 9:33 PM",127},
{"Mon 30 Jan 2017 9:35 PM",119},{"Tue 31 Jan 2017 5:11 PM",127},{"Tue 31 Jan 2017 5:14 PM",128},
{"Wed 1 Feb 2017 12:26 PM",133},{"Wed 1 Feb 2017 12:28 PM",127}};

thePlot = DateListPlot[data,
  PlotRange -> {Automatic, {80, 180}},
  GridLines -> {None, {60, 85, 100, 140}},
  GridLinesStyle -> Directive[Gray, Thin],
  ImageSize -> 540
  ]
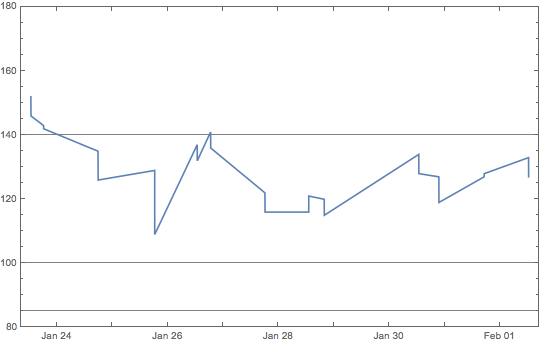
enter image description here

Attachments:
POSTED BY: Gregory Lypny
5 Replies

Dear S M Blinder,

Thanks, I am working on a similar code, but can I add also a Manipulator to start filling from the lowest peak up to the highest peak?

Your support will be highly appreciated !

Regards,....Jos

POSTED BY: Jos Klaps

Try this:

thePlot = 
 DateListPlot[data, PlotRange -> {Automatic, {80, 180}}, 
  GridLines -> {None, {60, 85, 100, 140}}, 
  GridLinesStyle -> Directive[Gray, Thin], Filling -> {1 -> 140}, 
  FillingStyle -> Gray, ImageSize -> 540]
POSTED BY: S M Blinder
Posted 7 years ago

Hi S M,

Thanks for replying. That doesn't work because it fills between the plot (the 1 in your reference) to 140 on the y axis. I think the only way is to plot horizontal lines over the range of dates and then refer to them with the fill.

Greg

POSTED BY: Gregory Lypny

Hi, here comes a somewhat 'quick and dirty' way:

thePlot = 
  DateListPlot[data, Joined -> True, PlotRange -> {Automatic, {80, 180}}, 
   GridLines -> {None, {60, 85, 100, 140}}, GridLinesStyle -> Directive[Gray, Thin], ImageSize -> 540];
gr = Graphics[{Opacity[.1], Blue, Rectangle @@ 
     Transpose[{First[PlotRange /. AbsoluteOptions[thePlot, PlotRange]], {100, 140}}]}];

Show[thePlot, gr]

giving:

enter image description here

Regards -- Henrik

EDIT:

... well, the above is probably too quick and too dirty! Here a hopefully cleaner solution (which gives the same):

dateMinMax = {"Mon 23 Jan 2017 12:41 PM", "Wed 1 Feb 2017 12:28 PM"};
dl1 = {#, 100} & /@ dateMinMax;
dl2 = {#, 140} & /@ dateMinMax;

thePlot = 
 DateListPlot[{data, dl1, dl2}, Joined -> True, 
  PlotRange -> {Automatic, {80, 180}}, GridLines -> None, 
  PlotStyle -> {Blue, Black, Black}, Filling -> {2 -> {3}}, 
  FillingStyle -> Directive[Opacity[0.1], Blue], ImageSize -> 540]
POSTED BY: Henrik Schachner
Posted 7 years ago

Hi Henrik,

Thanks for the tip and sorry for being so long to reply. I just took another look at the problem and came up with the same solution, that is, to plot horizontal lines and fill between them rather than to include gridlines. My attached code is similar to yours. Setting PlotRangePadding to None forces the fill to touch the left and right borders of the frame.

Greg

Attachments:
POSTED BY: Gregory Lypny
Reply to this discussion
Community posts can be styled and formatted using the Markdown syntax.
Reply Preview
Attachments
Remove
or Discard

Group Abstract Group Abstract