Hello everyone,
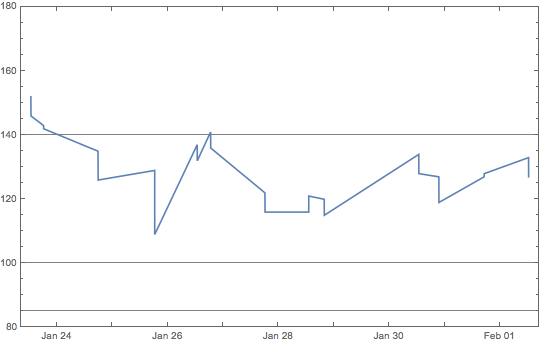
How can I add a transparent fill or background between two horizontal gridlines in a plot, in this case, a date list plot? The attached file contains an example.
Greg
How can I add a transparent fill or background between the horizontal \ gridlines located at 100 and 140?
data={
{"Mon 23 Jan 2017 12:41 PM",152},{"Mon 23 Jan 2017 12:44 PM",146},{"Mon 23 Jan 2017 6:11 PM",143},
{"Mon 23 Jan 2017 6:14 PM",142},{"Tue 24 Jan 2017 5:47 PM",135},{"Tue 24 Jan 2017 5:51 PM",126},
{"Wed 25 Jan 2017 6:22 PM",129},{"Wed 25 Jan 2017 6:22 PM",109},{"Thu 26 Jan 2017 12:47 PM",137},
{"Thu 26 Jan 2017 12:49 PM",132},{"Thu 26 Jan 2017 6:36 PM",141},{"Thu 26 Jan 2017 6:39 PM",136},
{"Fri 27 Jan 2017 6:09 PM",122},{"Fri 27 Jan 2017 6:12 PM",116},{"Sat 28 Jan 2017 1:08 PM",116},
{"Sat 28 Jan 2017 1:10 PM",121},{"Sat 28 Jan 2017 7:51 PM",120},{"Sat 28 Jan 2017 7:54 PM",115},
{"Mon 30 Jan 2017 12:50 PM",134},{"Mon 30 Jan 2017 12:53 PM",128},{"Mon 30 Jan 2017 9:33 PM",127},
{"Mon 30 Jan 2017 9:35 PM",119},{"Tue 31 Jan 2017 5:11 PM",127},{"Tue 31 Jan 2017 5:14 PM",128},
{"Wed 1 Feb 2017 12:26 PM",133},{"Wed 1 Feb 2017 12:28 PM",127}};

thePlot = DateListPlot[data,
  PlotRange -> {Automatic, {80, 180}},
  GridLines -> {None, {60, 85, 100, 140}},
  GridLinesStyle -> Directive[Gray, Thin],
  ImageSize -> 540
  ]
 Attachments:


