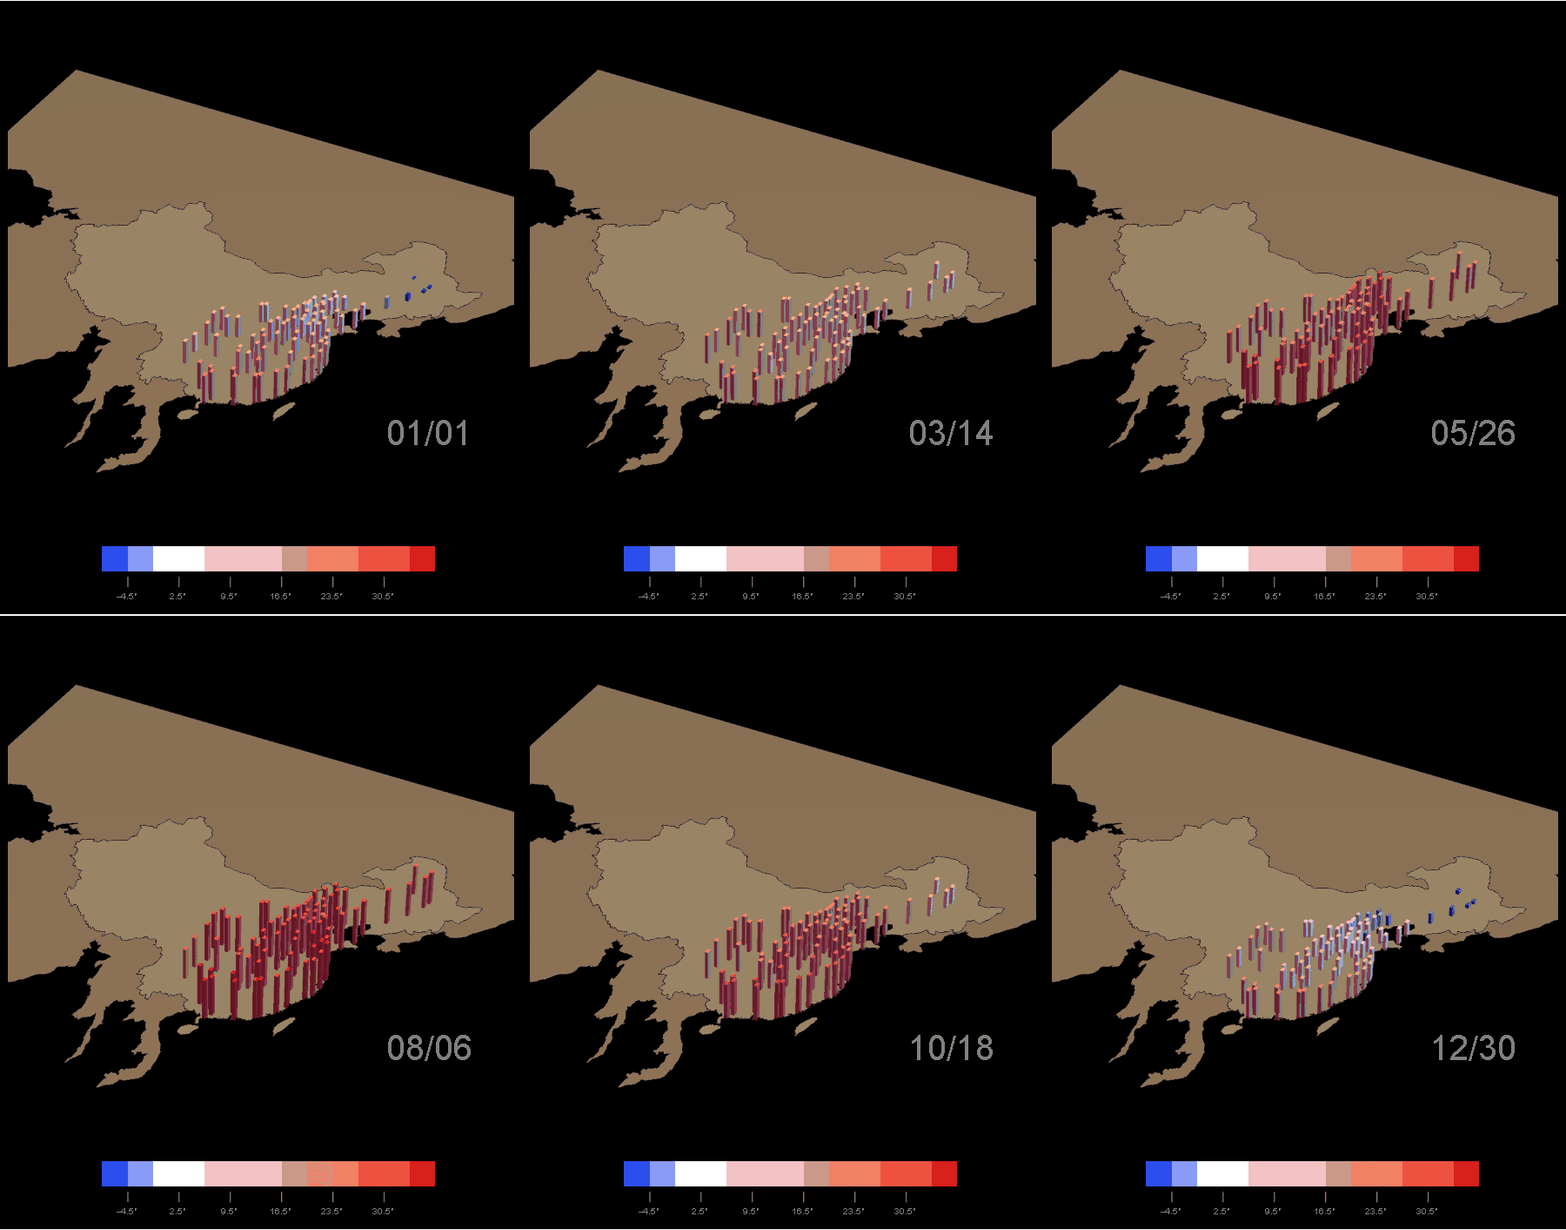
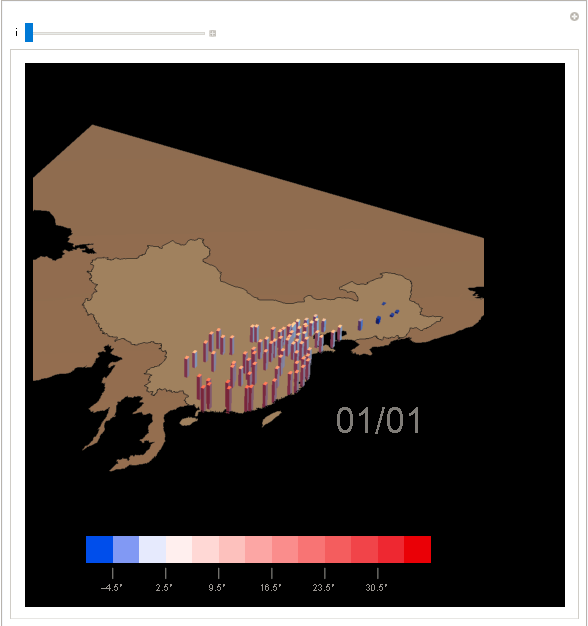
The following GIF illustrates daily temperatures in top 80 biggest cities around China. We can observe any change in temperature:
???GIF??????????????? 80 ??????????: 
Process the geographic data:
?????????:
getPolygon[entity_] :=
  Replace[
   EntityValue[
     entity,
     "Polygon"
     ] /. GeoPosition -> Identity,
   {longitude_, latitude_} :> {latitude, longitude, 0}, {-2}
   ];
neighbourings =
  getPolygon /@ CountryData["China", "BorderingCountries"];
creatercn =
  getPolygon /@ {Entity["Country", "China"],
    Entity["Country", "Taiwan"],
    Entity["City", {"HongKong", "HongKong", "HongKong"}],
    Entity["Country", "Macau"]};
Get the population and location information for these cities.
????????????????.
largeCities =
  Join[Flatten[
    CityData[{Large, #}] & /@ {"China", "Taiwan"}], {Entity[
     "City", {"HongKong", "HongKong", "HongKong"}],
    Entity["Country", "Macau"]}];
cityInfo =
 EntityValue[largeCities, {"Population", "Position"},
  "EntityAssociation"]
I only selected the top 80 biggest cities:
???????? 80 ??:
numCities = 80;
hugeCities = TakeLargestBy[cityInfo, #[[1]] &, numCities];
Get geographic coordinates:
??????
hugeCityCoords =
  Replace[Values[
    hugeCities[[All, 2, 1]]], {long_, lat_} :> {lat, long, 0}, {-2}];
customize the color legend that the temperature:
????????:
colorScl =
  Blend[{{-8, RGBColor[0.178927, 0.305394, 0.933501]}, {0, GrayLevel[
      1]}, {34, RGBColor[0.817319, 0.134127, 0.164218]}}, #] &;
clst = Subdivide[-8, 34, 12];
tempLegend =
 Graphics[{
   Table[{
     {colorScl[clst[[i]]], Rectangle[{i, 0}, {1, 0} + {i, 1}]},
     Thin, GrayLevel[0.6],
     {If[Mod[i, 2] == 0,
       Text[Row[{NumberForm[N@clst[[i]], {\[Infinity], 1}],
          "\[Degree]"}], {i, -1}]]},
     {If[Mod[i, 2] == 0, Line[{{i, -.2}, {i, -.6}}]]}
     }, {i, Length[clst]}]
   }, ImageSize -> 400
  ]
the time specification of the query:
???????????:
dayRange2016 =
  BlockMap[
   {Sequence @@ #, "Day"} &,
   DateRange[{2016, 1, 1}, {2016, 12, 31}, Quantity[1, "Days"]],
   2, 1
   ];
Now query temperature data (In fact, my approach is to export data in each loop):
???? (??????????????, ??????????????????????????????):
LaunchKernels[8];
hugeCityTempInfo =
  Transpose[
   Table[AirTemperatureData[Keys[hugeCities], dayRange2016[[i]],
     Mean], {i, Length[dayRange2016]}]];
Finally, let's build a dynamic model with Manipulate:
?????? Manipulate ???????:
Manipulate[
 With[{day = dayRange2016[[i, 1]]},
  Panel[
   Column[{
     Overlay[{
       Dynamic@
        Graphics3D[{{Opacity[0.6], china}, EdgeForm[None],
          Specularity[White, 20],
          Table[
           With[{
             tempValue = hugeCityTempInfo[[cityIdx, i]],
             cityCoord = hugeCityCoords[[cityIdx]]
             },
            {colorScl[tempValue],
             Cuboid[cityCoord,
              cityCoord + .5 {1, 1,
                 Rescale[tempValue, {-18, 42}, {0, 1}]}]}
            ],
           {cityIdx, numCities}
           ],
          {GrayLevel[0.5], neighbourings}
          },
          Axes -> False, ImageSize -> 600, BoxRatios -> {1, 1, .2},
         Boxed -> False, BoxStyle -> GrayLevel[0.3],
         PlotRange -> {{50, 150}, {0, 65}, {-.1, 1.1}},
         Background -> GrayLevel[0], ViewAngle -> 0.22,
         ViewCenter -> {{0.5`, 0.5`, 0.5`}, {0.36, 0.51}}],
       Graphics[{
         Inset[
          Style[DateString[#, {"Month", "/", "Day"}] &[day], 40,
           GrayLevel[0.5]]]
         }
        ]
       }, All, 1, Alignment -> {Right, Bottom}],
     tempLegend
     }, Background -> GrayLevel[0.], Alignment -> Center],
    Background -> GrayLevel[0.], ImageSize -> 600
   ]
  ],
 {{i, 1}, 1, 365, 1}
 ]

In addition, I have a account in WeChat, more articles please check here( Chinese only :-( )
??????????[????], ????????, ????????????.
??????: ???? ???/??/????
?????? ?2012?2016PM2.5???? ???????????? ???????? ????????? ??? 2016 ?PM2.5?
???? ?2016??????????? ?????????? ??????? ????????? ???2016????
?????? ?3D?????? ?????????? ???3D??????? ?????.???? ?Wolfram?????
 Attachments: