Message Boards Message Boards

0
|
7906 Views
|
3 Replies
|
1 Total Likes
View groups...
Share
Share this post:

Why function in multivariable integration limits: "not machine-sized #" ?

Posted 7 years ago
RegionPlot3D[Abs[Sin[z]] r, {r, 0, Sqrt[Cos[2 \[Theta]]]}, {\[Theta], 0, \[Pi]/4}, {z, 0, 2 \[Pi]}, PlotRange -> Automatic]

Trying to plot this returns error: ""Limiting value Sqrt[Cos[2\[Theta]]] in {r,0,Sqrt[Cos[2\[Theta]]]} \is not a machine-sized real number""

Looking through all the different 3DPlot types...did not find any examples of functions in the limits of multivariable integration...?

I'm converting from Maple10, which does not have any problem plotting the above. Mathematica11 will integrate a multivariable with the function in the limits...but no-go on plotting?

POSTED BY: David Harness
3 Replies

It was very difficult from your initial code to guess your final wish. Apropos, about the reason of the name RevolutionPlot3D[] we can something understand reading the page:

Cylindrical Coordinates

Posted 7 years ago

Thanks Valeriu, Actually I was able to get the result I was looking for with:

RevolutionPlot3D[{(Sqrt[Cos[2*\[Theta]]])*Sin[t], t}, {t, 0, 2 Pi}, {\[Theta], -Pi/4, Pi/4}]`

RevolutionPlot3D=Cylindrical Coordinates

This is the exact same code as Maple10 plot3d cylindrical coordinates, so perhaps RevolutionPlot3D could be called cylindrical coordinates.

POSTED BY: David Harness

In my opinion, there are two errors in your code. First, the interval for $r$ must be written correctly in the form specified by the documentation:

enter code here

In your code $r_{max}$ must be a number, but not a variable expression dependent of $\Theta$ and $z$.

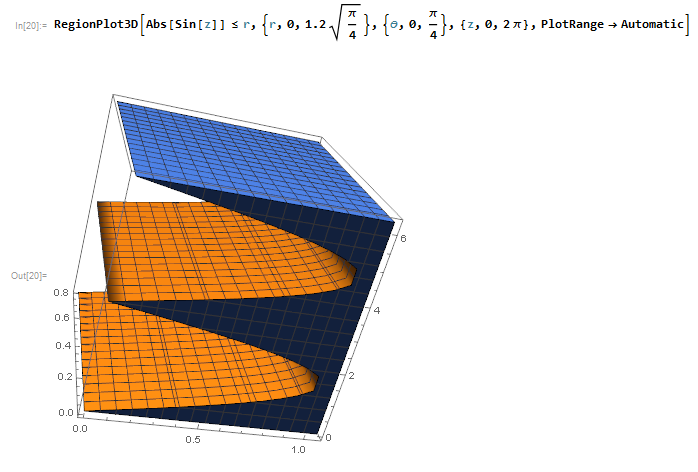
Second, the expression for RegionPlot3D[] must be an inequality. So, by providing these two corrections and fixing $r_{max}$ to value $1.2 Sqrt[\pi/4]$, the code

RegionPlot3D[
 Abs[Sin[z]] <= r, {r, 0, 1.2 Sqrt[\[Pi]/4]}, {\[Theta], 0, \[Pi]/
  4}, {z, 0, 2 \[Pi]}, PlotRange -> Automatic]

generates the following graph:

enter image description here

Sure, the code becomes more interesting if we use the function Manipulate[]:

Manipulate[
 RegionPlot3D[
  Abs[Sin[z]] <= r, {r, 0, rmax}, {\[Theta], 0, \[Pi]/4}, {z, 0, 
   2 \[Pi]}, PlotRange -> Automatic], {rmax, 0.1, 3}]
Reply to this discussion
Community posts can be styled and formatted using the Markdown syntax.
Reply Preview
Attachments
Remove
or Discard

Group Abstract Group Abstract