We talk about paintings having line and direction. I made a short program to visualize linear features in an image. Here is what it does:
- Resize the image.
- Detect edges in the image.
- Find lines among the edges.
- Build a graphic showing the sum of the lines in various directions.
- Show the longest line in the image.
Please see code below. I had to overcome a few obstacles to get this to work right. First, larger images (I tested up to 2500 by 2500 pixels) produced small artifacts during edge detection that muddied up the data, I think from the grain of the canvas, impasto highlights, cracks in the paint, etc. To solve this, I resize larger images to a maximum width of 480 pixels.
Paintings with indistinct edges can result in blank edge detection images. To solve this, I run the edge detection through a loop that tests to see whether there are enough white pixels (edges) to move on to the next step. If not, it lowers the edge detection threshold and tries again.
The ImageLines[] function returned lines along the borders of the images, so I filtered out lines that ran along the borders.
My first thought was to present the data in a polar coordinate plot. It worked, but the results didn't communicate what I had hoped. After some trial and error, I came up with a disk with 48 sectors each representing a bin of data. For instance, one bin would be the sum of the lines whose direction was between 0° and 7.5°, another bin would have the sum of lines between 7.5° and 15°, etc. (I used radians in the program.) The sectors have different radii based on the data. The graphic is symmetric because a line whose direction is 90°, say, also has a direction of 270°. On top of this multi-sectored disk, I show the direction of the longest continuous line that the program could find in the image.
Wide paintings produced exaggerated data in the horizontal, and tall paintings in the vertical, so I scaled each data bin according to its horizontal component.
In testing, I made a second graphic where I superimpose the longest line onto the image. This seemed to be a worthwhile bit of information, so I kept it. When I taught art, this would have been a useful starting point for a discussion about lines in the composition of a painting.
We sometimes use technology to analyze art. For example, we take x-rays of a painting, examine it with a raking light, and calculate its fractal dimension. All of these reveal something new about the piece.
The results are pretty cool. Here are some samples:
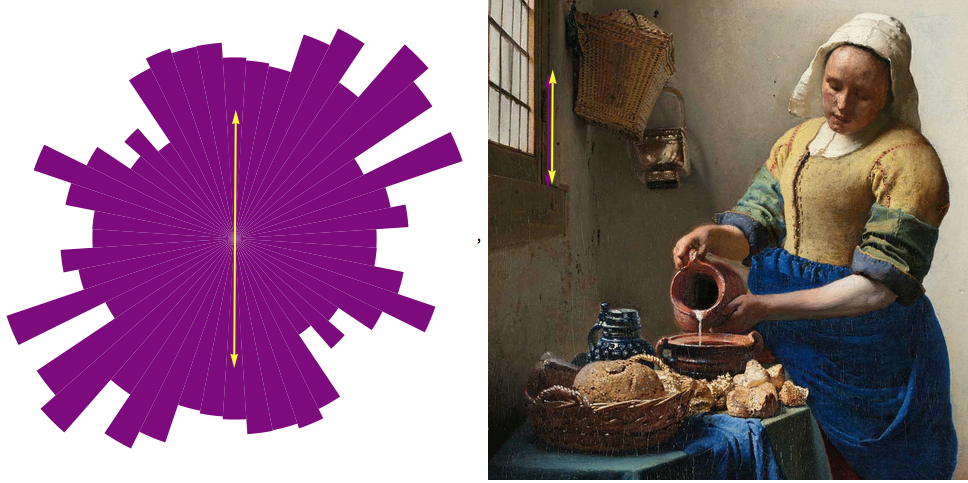
This Vermeer painting doesn't have prominent linear features or direction.
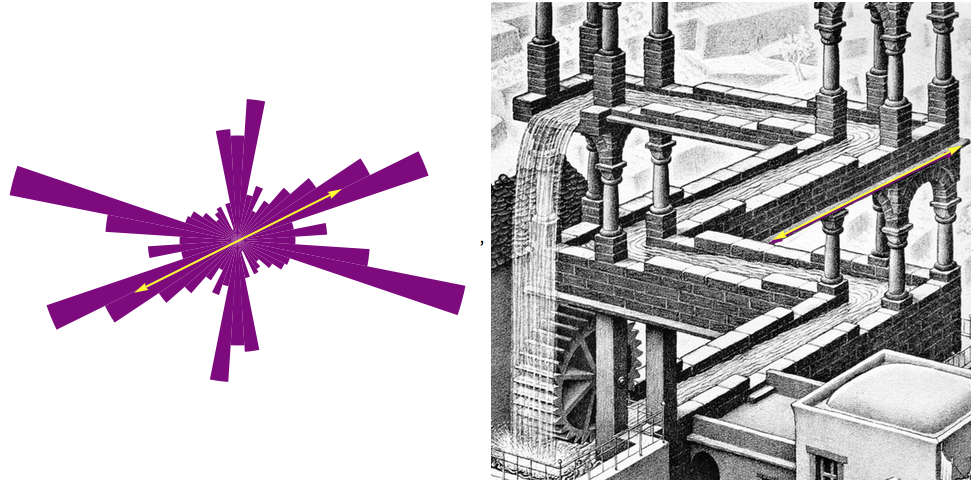
This Escher piece has strong lines in three distinct directions.
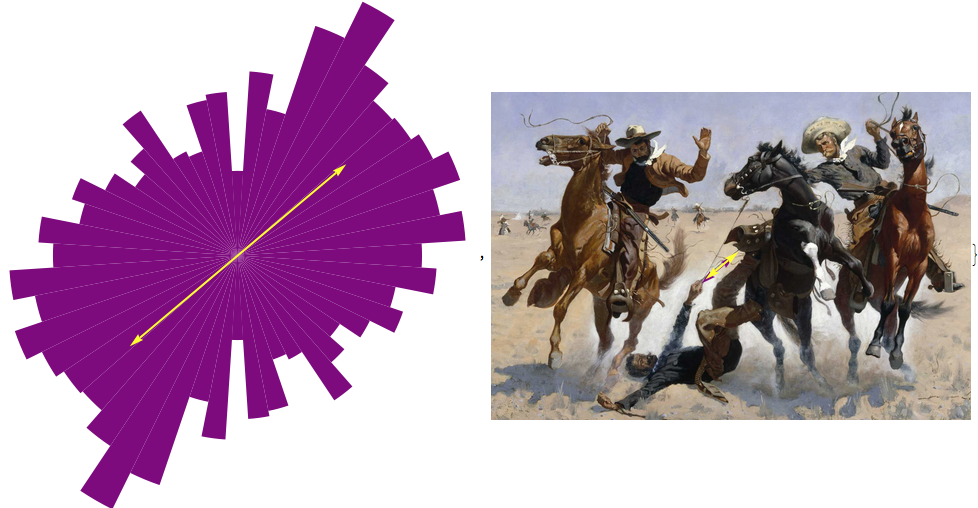
A good discussion starter: "Why does the computer think that this Remington painting has more directionality lower left to upper right?"
The failures are also interesting. The program didn't know what to make of a Jackson Pollock painting (who does?), I think because there are so few straight lines in his paintings. Roy Lichtenstein's technique of imitating printing dots causes the program to find way too many vertical lines for some reason.
I tried it on 35 different famous paintings and 35 photos of flowers. The results are pretty consistent with what I would expect.
This was a fun little project that pushed my Wolfram skills to their limits. If anyone in the community wants to use it or build on my code, feel free to do so. I wouldn't mind some feedback if you do.
Thanks for reading this longwinded post.
Mark Greenberg
CODE
img =;
If[ImageDimensions[img][[1]] > 480, img = ImageResize[img, 480]];
dims = ImageDimensions[img];

(* Section 2 forms an edge detection image. *)
thresh = .2;
whiteRat = 0;
While[whiteRat < .075,
  ed = EdgeDetect[img, 5, thresh, Method -> "ShenCastan"];
  whiteRat = Count[Flatten[ImageData[ed]], 1]/
   Count[Flatten[ImageData[ed]], 0];
  If[thresh > .005, thresh -= .005, Break[]]];

(* Section 3 forms a list of line segments not on the perimeter. *)

lines = Flatten[
   ImageLines[ed, 0, Method -> {"Segmented" -> True},
    MaxFeatures -> 240], 1];
limLt = dims[[1]]/20;
limRt = (19 dims[[1]])/20;
limTp = dims[[2]]/20;
limBt = (19 dims[[2]])/20;
lines = DeleteCases[
   lines, {{a_, b_}, {c_,
      d_}} /; (a < limLt && c < limLt) || (a > limRt &&
       c > limRt) || (b < limTp && d < limTp) || (b > limBt &&
       d > limBt)];

(* Section 4 transforms each line segment into a {angle, length} \
pair. *)
angLen = {If[#[[2, 1]] == #[[1, 1]], \[Pi]/2,
      ArcTan[(#[[2, 2]] - #[[1, 2]])/(#[[2, 1]] - #[[1, 1]])]],
     Sqrt[(#[[2, 2]] - #[[1, 2]])^2 + (#[[2, 1]] - #[[1, 1]])^2]} & /@
    lines;

(* Section 5 finds the longest line. *)

longLine = First[Sort[angLen, #1[[2]] > #2[[2]] &]];
longLineEnds = First[lines[[First[Position[angLen, longLine]]]]];

(* Section 6 creates 24 bins for angles -90\[Degree] to 90\[Degree]. *)

binLen = {Round[#[[1]], \[Pi]/24], #[[2]]} & /@ angLen;
bins = DeleteDuplicates[#[[1]] & /@ binLen];

(* Section 7 records the total segment lengths in each bin. *)

tots = {};
For[i = 1, i <= Length[bins], i++,
  tots = Append[tots,
    Total[#[[2]] & /@ Cases[binLen, {bins[[i]], _Real}]]]];
data = {#[[1]], (Abs[Sin[#[[1]]]]*#[[2]]) + (Abs[Cos[#[[1]]]]*
        dims[[2]]/dims[[1]]*#[[2]])} & /@
   Partition[Riffle[bins, tots], 2];

(* Section 8 forms the graphic objects. *)

sectors =
  Disk[{0, 0}, #[[2]], {#[[1]], #[[1]] + \[Pi]/24}] & /@ data;
mirrors =
  Disk[{0, 0}, #[[
      2]], {#[[1]] + \[Pi], #[[1]] + \[Pi] + \[Pi]/24}] & /@ data;
arrowLen = .5*Max[#[[2]] & /@ sectors];

(* Section 9 assembles the sector and image graphics. *)

pic1 = Graphics[{
    Purple, Rotate[Join[mirrors, sectors], -(\[Pi]/48)],
    Yellow, Thick, Arrowheads[{-.03, .03}],
    Rotate[Arrow[{{-arrowLen, 0}, {arrowLen, 0}}], longLine[[1]]]
    }, ImageSize -> {{480}, {540}}];
pic2 = Show[img,
   Graphics[{Purple, Thick, Arrowheads[{-.03, .03}],
     Translate[Arrow[longLineEnds], {-2, -2}], Yellow,
     Translate[Arrow[longLineEnds], {2, 2}]}],
   ImageSize -> {{480}, {540}}];

{pic1, pic2}


