Some time ago I published a blog post about combination tones and the nonlinearity of the human ear.
Per request, I will show here how to play with this topic in Mathematica.
A combination tone (also called Tartini tone after the violinist Giuseppe Tartini who famously described them) is a phenomenon where playing two tones of different frequencies at the same time causes a third tone (or several others) to be heard as well. As you will see below, this is a physical effect: the combination tone appears due to nonlinear transmission in the middle ear.
Preliminaries
Before starting, let's set up the Play function to output at higher than default quality:
SetOptions[Play, SampleDepth -> 16, SampleRate -> 22050]
You can go to a full 44100 Hz, but then Play will be slower. Using a lower sampling rate risks audible aliasing effects.
We will play the two tones on separate stereo channels (Play[{left, right}, ...]). This is so that they only mix in our ears, and not in your audio playback electronics. I want to convince you that the effect is due to the ear's nonlinearity, and not that of your speakers or amplifier. So please listen to the samples with loudspeakers (not headphones), so both of your ears can hear both channels at the same time.
Since this is a nonlinear effect, it will be audible only if the volume is high enough. Turn up the volume a bit, or better: lean closer to (or away from) your speakers to control the volume level near your ears.
I also advise you not to use the interface of Audio objects for stereo playback during these experiments. Unfortunately, Mathematica 11.0 and 11.1 have a bug (at least on OS X) where sounds are mixed down to mono before playback. This affects only playback, not processing. The interface presented by the older Sound objects doesn't have this problem.
The experiment
Let's start by playing a 1000 Hz and a 1500 Hz tone together:
Play[{Sin[1000 2Pi t], Sin[1500 2Pi t]}, {t, 0, 3}]
If you listen carefully, you may be able to hear a lower pitch tone at $1500-1000 = 500 \;\mathrm{Hz}$. The effect is fairly subtle, and many people have trouble hearing this. It may be easier to hear if you compare it to an actual 500 Hz tone, Play[Sin[500 2Pi t], {t, 0, 3}].
There is a less often used, but much better way to demonstrate the effect. Since the most prominent combination tone tends to be the difference of the two frequencies, $f_c = |f_1 - f_2|$, we can use a steady tone and a lower falling tone. Their difference will be increasing. It is much easier to notice that there is a third tone present when its pitch is clearly changing in another direction than that of the base tones we are actually playing.
How do we create a tone with a changing frequency? The phase of a wave, $\varphi(t)$, is the integral of its angular frequency, $\omega(t) = 2\pi f(t)$. To get a tone whose pitch falls by 100 Hz per second, starting at 1300 Hz, we need to use the following phase:
Integrate[1300 - 100 t, t]
(* 1300 t - 50 t^2 *)
So let's try it:
snd = Play[{Sin[1500 2 Pi t], Sin[(1300 t - 50 t^2) 2 Pi]}, {t, 0, 3}]
We play a steady and a falling tone But I can clearly hear a rising tone as well. If we play only one channel at a time, the rising tone is no longer audible. Try it: AudioChannelSeparate[snd].
The explanation
Where does the combination tone come from, and how is it related to nonlinear transmission? Let's think about what happens if we pass the sum of two sine waves of different frequencies through a non-linear amplifier, described by the function $a(u)$. (This is admittedly a much simplified model of what happensa nonlinear oscillator would be more accurate. But it's simple and it explains the phenomenon.) The Taylor expansion of a non-linear $a(u)$ will also contain higher order terms:
$$a(u) = c_1 u + c_2 u^2 + c_3 u^3 + \cdots$$
The linear term, $u$, doesn't change the signal. What about the square term, $u^2$? Mathematica makes it easy to do the calculation:
(Sin[w1 t] + Sin[w2 t])^2 // TrigReduce
(* 1/2 (2 - Cos[2 t w1] - Cos[2 t w2] + 2 Cos[t w1 - t w2] - 2 Cos[t w1 + t w2]) *)
Notice that the sum (w1+w2) and the difference (w1-w2) of the frequencies appeared too (in addition to the harmonics 2 w1 and 2 w2 ). This explains why the most prominent combination tone we are hearing is the difference tone.
What about the third order term?
(Sin[w1] + Sin[w2])^3 // TrigReduce
(* 1/4 (9 Sin[w1] - Sin[3 w1] - 3 Sin[w1 - 2 w2] +
   3 Sin[2 w1 - w2] + 9 Sin[w2] - Sin[3 w2] - 3 Sin[2 w1 + w2] -
   3 Sin[w1 + 2 w2]) *)
Now we have 2 w1+w2, 2 w1-w2, w1-2 w2 and w1+2 w2.
Generally, the $k$th order term will introduce $n \omega_1 + m \omega_2$ integer linear combinations, where $n,m \in \mathbb{Z}$ and $|n|,|m| < k$.
Where does the nonlinearity come from? We play the two sounds on different stereo channels (ideally on loudspeakers which are in contained in separate housings), to rule out any effects coming from the electronics. Transmission through the air is fairly linear, so that can be ruled out too. What remains is our ear.
The higher order a term, the less loud the corresponding combination tones are. However, human loudness perception logarithmic, so these do not necessarily sound so much quieter so as not to be audible. Can we hear the third order tones?
If I play the last example for a bit longer than in our original experiment,
Play[{Sin[1500 2 Pi t], Sin[(1300 t - 50 t^2) 2 Pi]}, {t, 0, 5}]
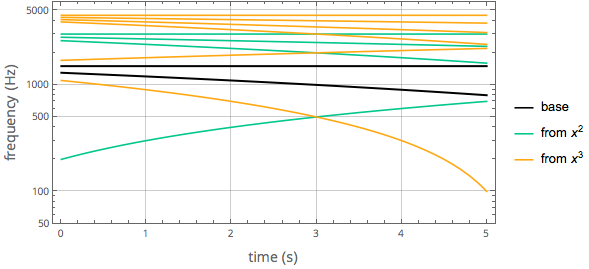
towards the end and of the samepl I hear a much more sharply falling tone as well. This happens to be the 2 w2-w1 third-order combination tone. We notice it towards the end only because due to our logarithmic perception of the pitch, it will appear to fall with an accelerating rate as it approaches zero. This makes it stand out.
This becomes clear from a LogPlot of the changing pitches:
a = 1300 - 100 t; (* falling pitch *)
b = 1500; (* steady pitch *)
sqc = RGBColor[0., 0.780007, 0.550005];
cuc = RGBColor[1., 0.659993, 0.069994];

tmax = 5;
pl = Legended[
  Show[
   LogPlot[{a, b} // Abs // Evaluate, {t, 0, tmax}, PlotStyle -> Directive[Thick, Black], GridLines -> Automatic],
   LogPlot[{a + b, a - b, 2 a, 2 b} // Abs // Evaluate, {t, 0, tmax}, PlotStyle -> sqc],
   LogPlot[{2 a - b, 2 b - a, 2 a + b, 2 b + a, 3 a, 3 b} // Abs // Evaluate, {t, 0, tmax}, PlotStyle -> cuc, PlotRange -> All],
   PlotRange -> Log@{50, 6000}, Frame -> True, Axes -> False,
   FrameLabel -> (Style[#, FontSize -> 14] &) /@ {"time (s)", "frequency (Hz)"}, AspectRatio -> 1/2, ImageSize -> 500,
   BaseStyle -> {FontFamily -> "Open Sans"},
   PlotRangePadding -> {Automatic, 0}
   ],
  LineLegend[{Black, sqc, cuc}, {"base", "from \!\(\*FormBox[SuperscriptBox[\(x\), \(2\)],TraditionalForm]\)",
    "from \!\(\*FormBox[SuperscriptBox[\(x\), \(3\)],TraditionalForm]\)"}]
  ]

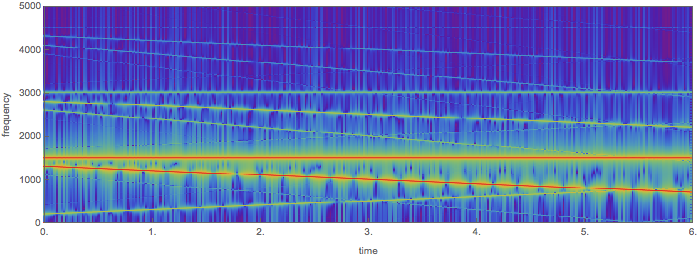
We can also pass the sum of the two tones through a non-linear function of our own design, and look at the spectrogram to see all combination tones:
amp[u_] := Log[u + 1]
This "amplifier function" contains all higher order terms with coefficients that are comparable in magnitude:
amp[u] + O[u]^6
$$u-\frac{u^2}{2}+\frac{u^3}{3}-\frac{u^4}{4}+\frac{u^5}{5}+O\left(u^6\right)$$
The spectrogram can be plotted as follows:
Spectrogram[
 Play[amp[0.25 (Sin[1500 2 Pi t] + Sin[(1300 t - 50 t^2) 2 Pi])], {t, 0, 6}],
 PlotRange -> {All, {0, 5000}},
 ColorFunction -> "Rainbow",
 FrameLabel -> {"time", "frequency"}
 ]

I hope you enjoyed this post. You can read a bit more about the background of combination tones, and listen to an additional experiment in the original blog post.