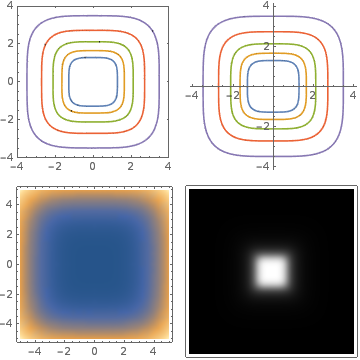
Hi Mariana, doing just okay. Trouble with calculus class... I think I know exactly what you are talking about, but hopefully no one is bothering you about any Weierstrass functions. Here are a few different in-plane plots
g1 = ContourPlot[ Evaluate[x^4 + y^4 == Exp[#] & /@ Range[5]], {x, -5, 5}, {y, -5, 5}, PlotRange ->
{{-4, 4}, {-4, 4}}]
g2 = PolarPlot[ Evaluate[ r /. Solve[  Evaluate[
x^4 + y^4 /. {x -> r Cos[\[Theta]],   y -> r Sin[\[Theta]]}] == k, r][[1]] /. k -> Exp[#] & /@
Range[5]], {\[Theta], 0, 2 Pi},   PlotRange -> {{-4, 4}, {-4, 4}}];
g3 = DensityPlot[x^4 + y^4, {x, -5, 5}, {y, -5, 5}];
g4 = ArrayPlot@ Table[ArcTan[x^4 + y^4], {x, -5, 5, .01}, {y, -5, 5, .01}];

GraphicsGrid[{{ g1, g2 }, { g3 , g4 }}]
If you really look into it, everything in-plane can be drawn with Graphics:
Head /@ {g1, g2, g3, g4}
Out[]=  {Graphics, Graphics, Graphics, Graphics}
I think direct use of the Graphics function is the way to get highest quality results. Read The Function Manual!


