This project uses Mathematica, Arduino and Java source code and is presented as a zipped folder via GitHub: PhotogateDriver.zip
A staple of experimental physics; an infrared beam forms a tripwire which when crossed registers as an event and triggers a timing unit. The timer may operate in various modes, for example, measuring the duration of a single event or the time between two consecutive events.
A while back I made a photogate intended to trigger an Arduino-based timer. The inspiration came while teaching a Higher Physics evening class where I used the ubiquitous photogate in various demonstrations. While I cant remember the manufacturer or model of the photogate equipment I used, its design featured elements found in modern equipment too such as proprietary computer software interfaces and obscure connectors. Large, expensive, with a cumbersome interface and a little single line display to read the data from. I began to envision my ideal photogate timer.
- The interface should be via a computer and not a proprietary receiving unit
- The photogte should deliver a digital signal (ideally TTL compatible) to trigger some timing unit. Not necessarily the Arduino
- Power supply should be that from USB, either from a computer or cheap wall adaptor
- And be cheap to produce.
I threw together a prototype.
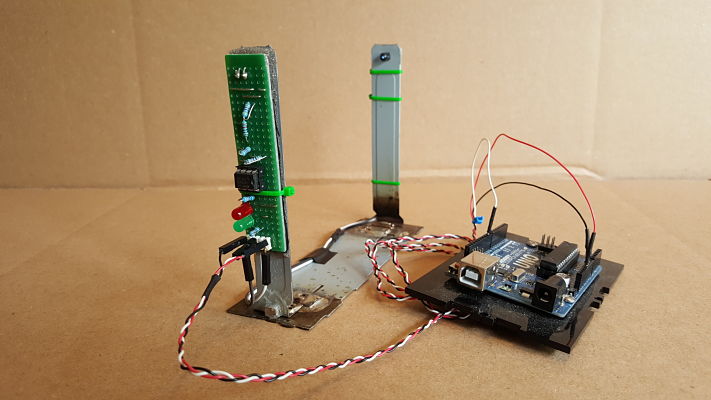
The frame is made from those panels covering the expansion bays on the back of a PC case which are brazed to another part of the same case. The IR LED was taken from an old TV remote control.
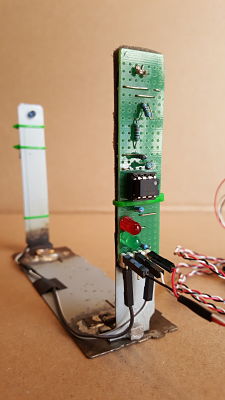
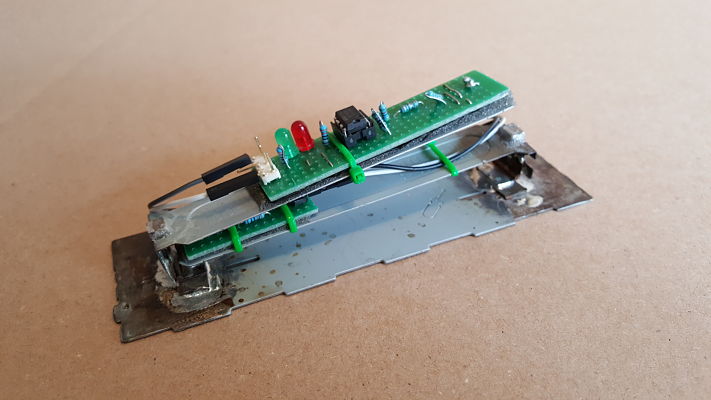
It has hinges and 'folds' when not in use.
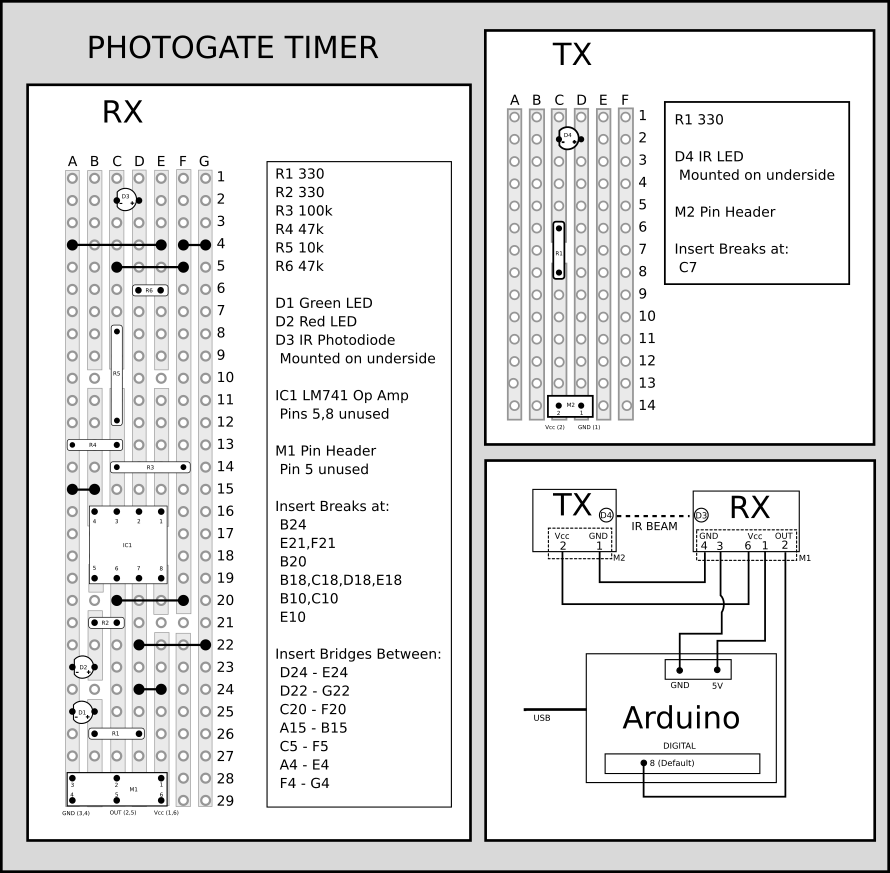
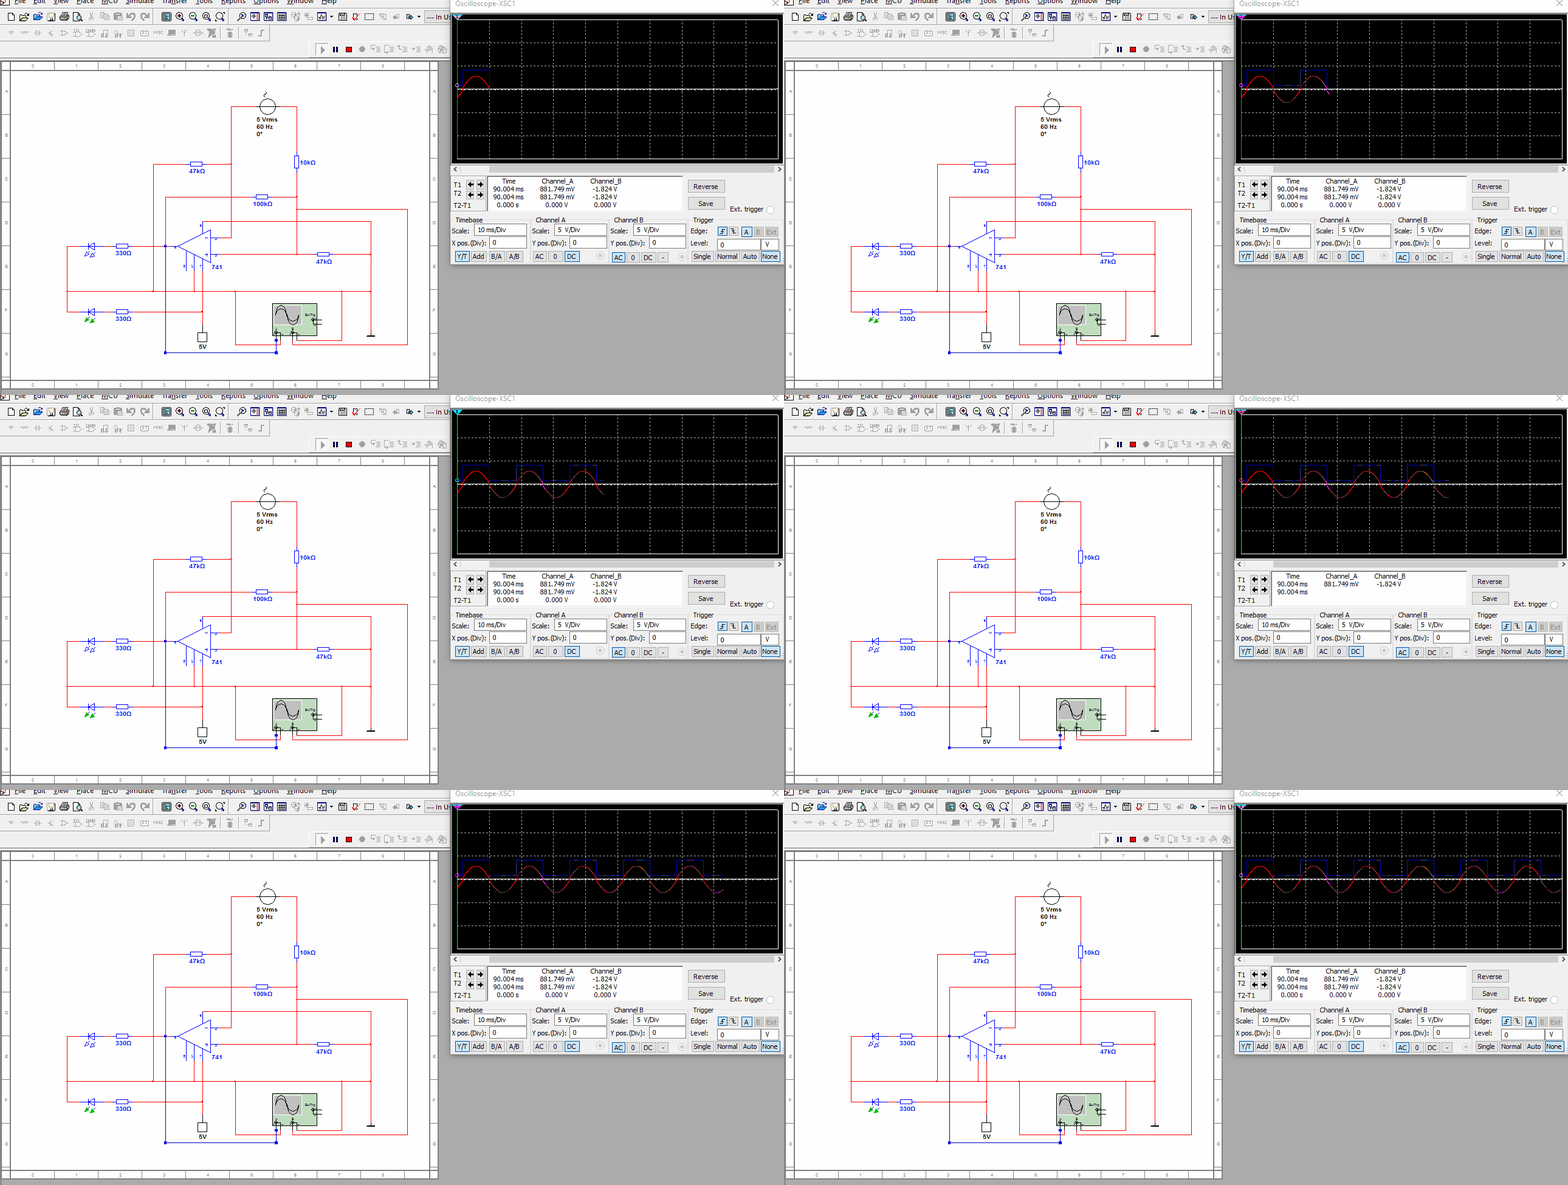
The reverse biased photodiode D3 is operating in photoconductive mode, R6 controls its sensitivity. While the IR beam is incident on D3 a current will flow thus the detector is active low. As an analogue device, D3 will produce a variable output only reaching a high state once the beam is mostly obscured. This is an issue when dealing with slow moving objects, thus an inverting schmitt trigger processes the the output from the photodiode resulting in a true digital signal. The trigger is inverting as the detector is still active low.
The trigger was made using an op amp and R3,4,5 determine the thresholds upon which the op amp saturates and delivers a constant voltage. I used an online tool to easily determine the resistor values: Inverting Schmitt Trigger Calculator. The circuit was modelled in MultiSim before prototyping on a breadboard. D3 is replaced with an AC source such that its simulated trace (red) represents the amount of the IR beam which is obscured. Even a slight perturbation to the beam is enough to trigger an output (blue).
Based on a program for a stopwatch, the Arduino sketch works by monitoring pin 8 and comparing its state to the last time it was read. If the input is found to have changed from a low to high state then the timer starts. If the state then changes from high back to low then the timer ends and the result is printed over serial. This measures the time that the beam was interrupted for (event timer).
// check for a low to high transistion, if true then found a new button press while clock is not running - start the clock
if (gateState_current == HIGH && gateState_last == LOW){
    // store the start time
    startTime = micros();

    cumulativeTime = micros();

    // store buttonState in lastButtonState, to compare next time
    gateState_last = gateState_current;

    // check for a high to low transition.  if true then found a new button press while clock is running - stop the clock and report
    }else if (gateState_current == LOW && gateState_last == HIGH){

       // store elapsed time
       eventTime = micros() - startTime;

       // store buttonState in lastButtonState, to compare next time
       gateState_last = gateState_current;

       // routine to report elapsed time
       Serial.print(countMode2);
       Serial.print("_");
       // divide by 1000 to convert to seconds - then cast to an int to print
       Serial.print(eventTime / 1000000L);
       // print decimal point
       Serial.print(".");
       Serial.print(eventTime % 1000000L);
       Serial.print("~");

    }else{
       // store buttonState in lastButtonState, to compare next time
       gateState_last = gateState_current;
    }
}
It also has a gap timer which measures time between two interruptions and an event counter which measures when events occur in terms of time since the program started running via micros(). Each other modes work mostly on a variant of the code above.
A basic computer interface can be achieved by opening the Arduino IDE and copy/pasting the results from the serial monitor. This inelegant approach has the advantage of simplicity but depends on the IDE being installed. I wanted a more lightweight solution and the ability to interface it with Mathematica. My first attempt worked well enough as a demonstration but was unreliable and prone to delivering erroneous results, then other things came up and I moved on from it, satisfied that it was an effective prototype. I'm a much better programmer than I was when I started this and recently dug up the project with the aim of a more satisfying conclusion. The main issue was that I wanted a live reading of the data from the photogate as it operated. This feature isn't necessary since the data can be retrieved in batch but seeing it scroll down the screen in real time is quite satisfying.
I've been wanting to experiment with Mathematicas JLink feature for a while so I envisioned the computer interface as a Java app which would return data from the serial link to a Mathematcia notebook with a GUI and other nice features. This also gives the photogate setup more portability since the Java app can be called via the operating systems terminal, albeit with limited functionality for now. I tried this using a Windows PC without any Arduino software and was able to monitor its data via command line. The Java app uses the Java Simple Serial Connection (jSSC) library and is platform independent, hence the Mathematica notebook should be too. There are some examples of jSSCs usage here.
From the Mathematica notebook from the project folder, we have
classPath =  FileNameJoin[{NotebookDirectory[], "Java", "dist", "PhotogateDriver.jar"}, OperatingSystem -> "Unix"];
Needs["JLink`"];
InstallJava[ClassPath -> classPath];
serialLink = JavaNew[LoadJavaClass["photogatedriver.PhotogateDriver"]];
As the Java class path is defined using NotebookDirectory you'll need to take care if moving files around. Interestingly, only the "Unix" option for FileNameJoin returns a valid path for InstallJava when defining the class path, even when using a Windows machine. The Java app is now loaded and saved as serialLink. It has methods for establishing a connection to the Arduino, listing serial ports, switching between gap timer, event timer etc, and are called by Mathematica very easily,
findPorts := ports = serialLink@listPorts[];
listPorts := serialLink@listPorts[];
clearLog := serialLink@clearLog[];
eventMode := serialLink@modeEventTime[];
gapMode := serialLink@modeGapTime[];
countMode := serialLink@modeEventCount[];
returnLog := ToExpression /@ StringSplit[#, "_"] & /@ StringSplit[serialLink@printLog[], "~"];
listPorts is OS specific so (in theory, I haven't tested it) it should return the correct serial port string for whichever OS you're using. ReturnLog retrieves all the current data and prints it to the notebook. The Arduino prints the data as a single line so StringSplit is used to separate its components into a list.
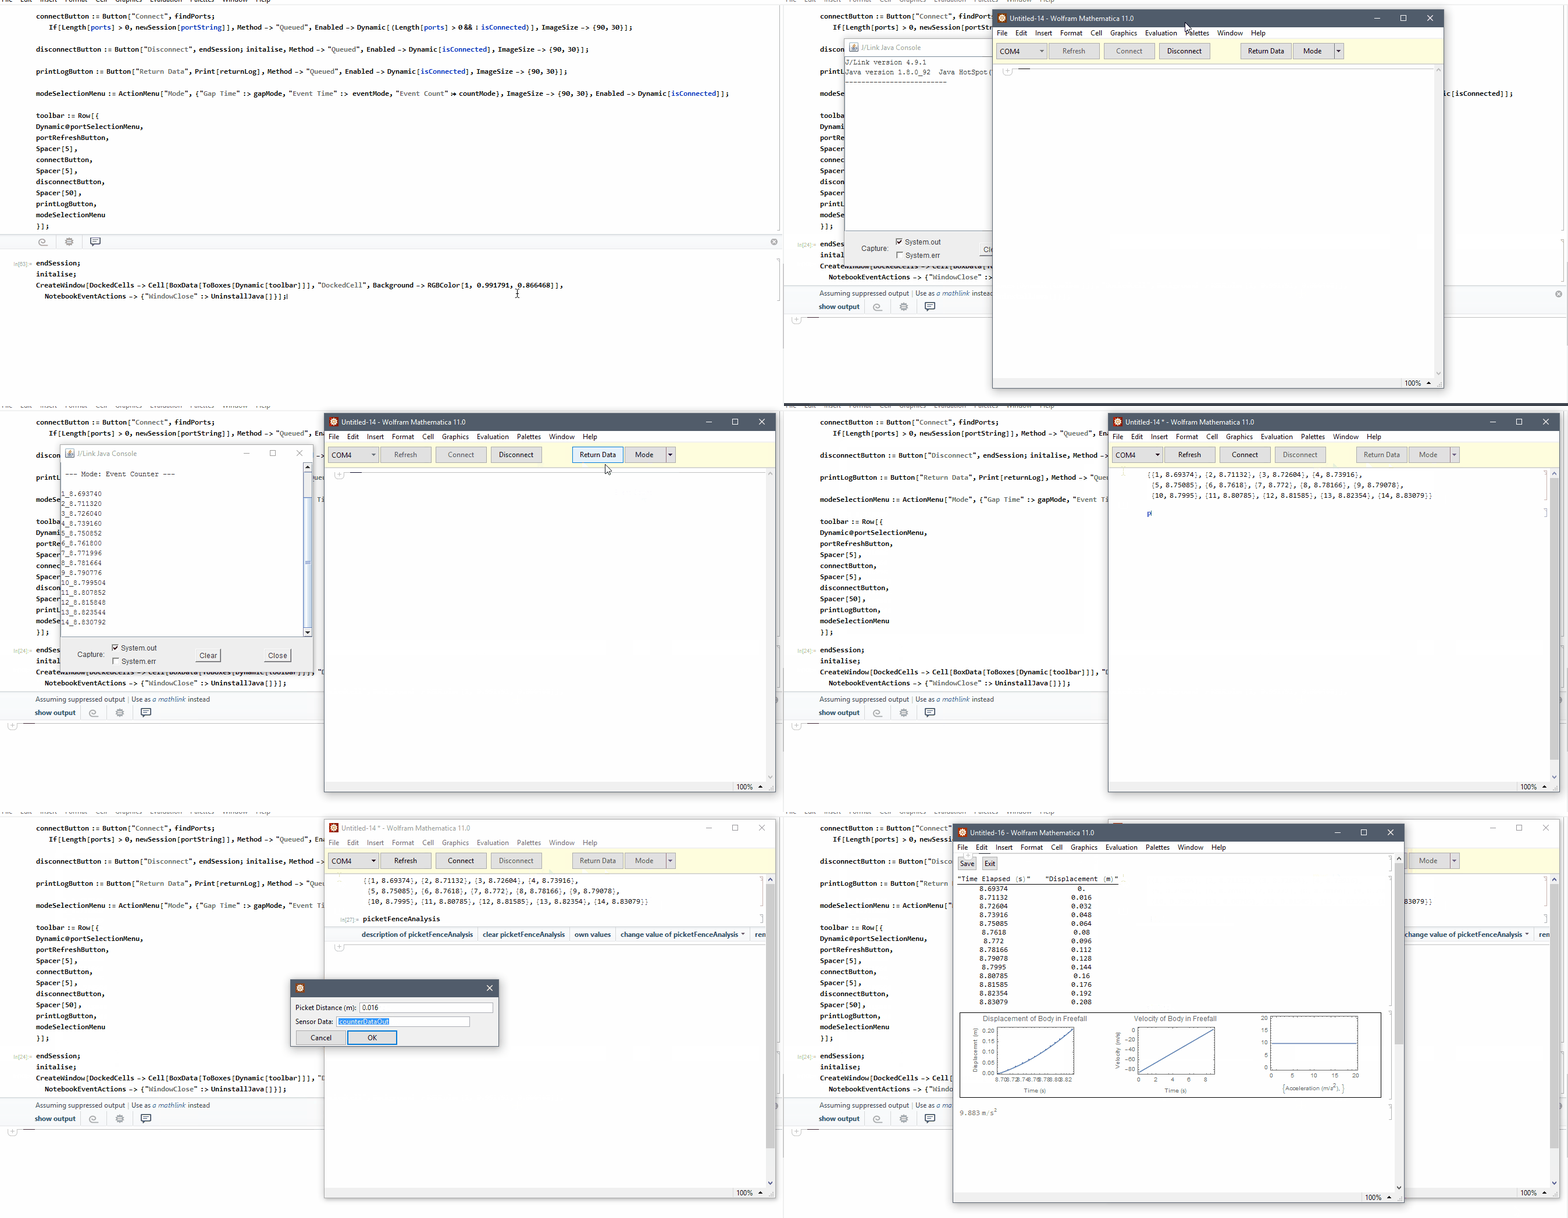
Evaluating the notebook opens a new document with a docked toolbar for controlling the photogate.
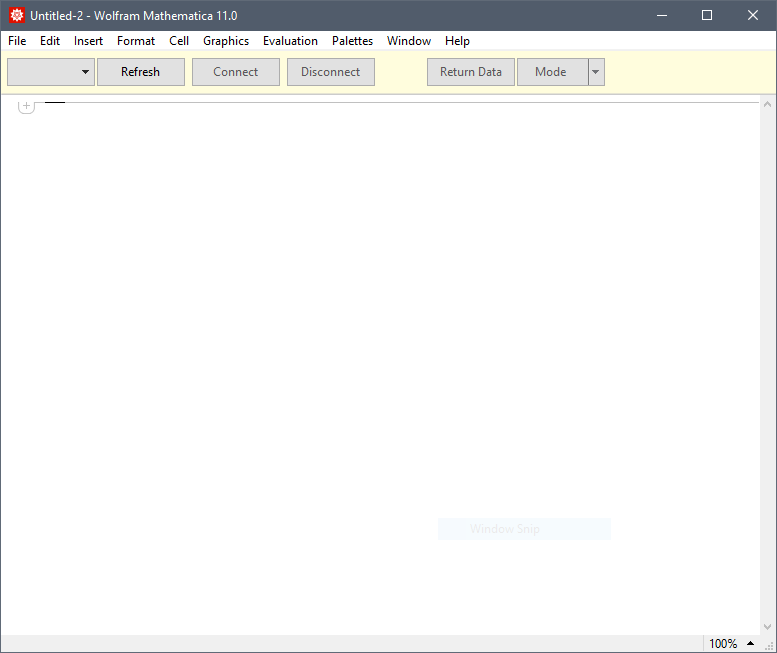
This is without any connected devices. If the program is launched before the Arduino is plugged in, clicking 'Refresh' will populate the selection menu with a list of detected serial ports. Once a port is selected, 'Connect' will enable and a link to the device will be established and the Java console window will open - this provides the live update of data from the photogate. I don't believe that its possible to call Java methods dynamically, hence I'm piggy-backing off the Java console. A future version could have a custom GUI built in to perform the same feature which Mathematica could open, but this works fine for now.
As an example of the photogate and interface I'll present a run of the falling picket fence experiment. Since it measures the acceleration of freefall, its result is easy to verify.
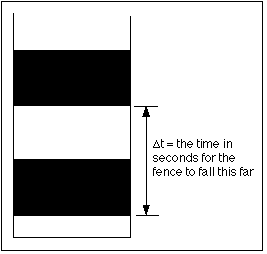
I made my 'picket fence' out of lego, with a picket distance of 0.016 m. The simplest way to measure delta t (from the image) is by using the photogates event counter which marks the time of the beginning of each obstruction of the beam.
For setup I taped the connected photogate to a vertical surface, launched the Mathematica interface, selected 'Event Counter' and dropped the picket fence.
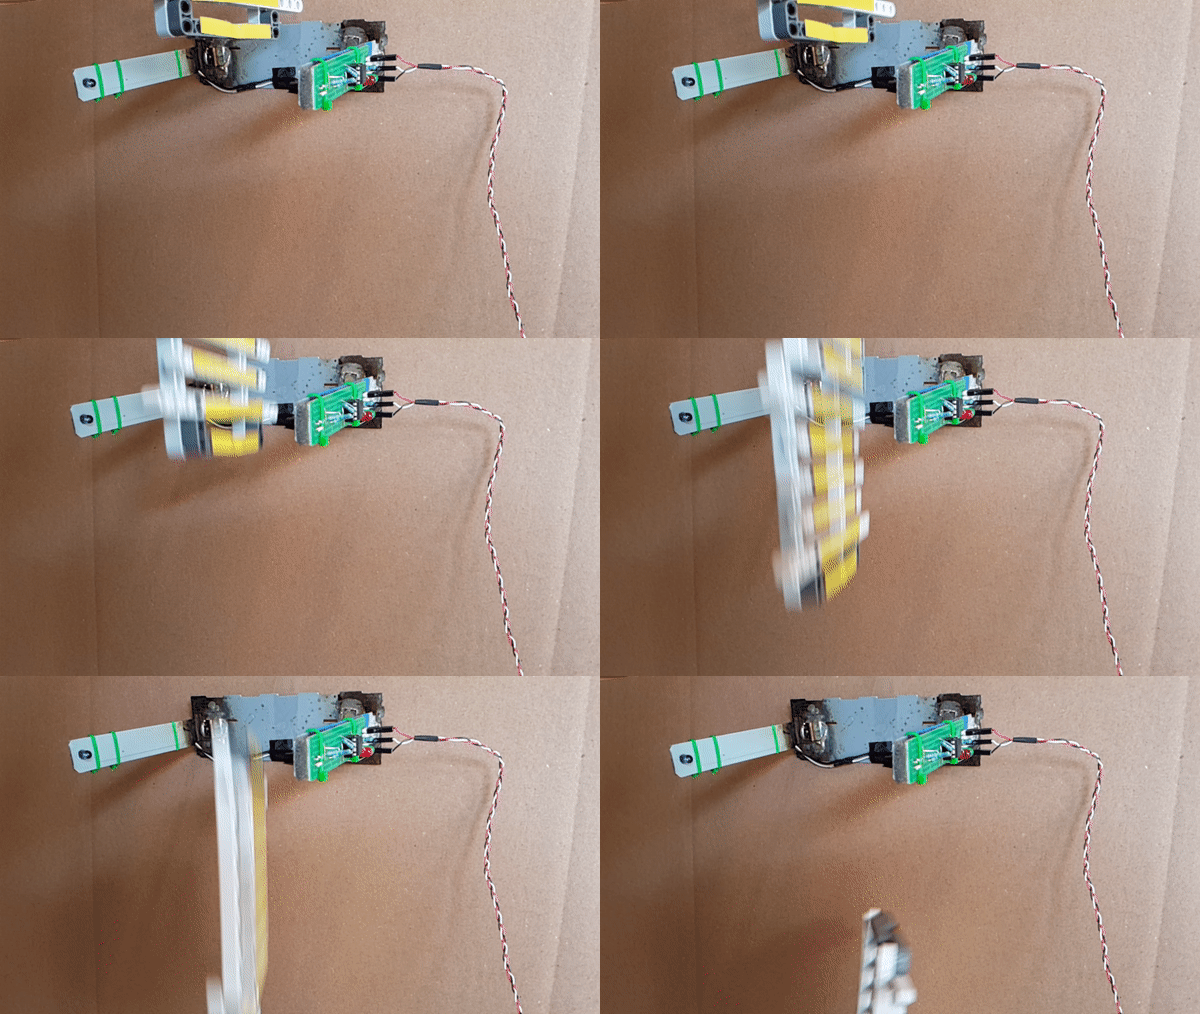
Evaluating picketFenceAnalysis launches a tool for the automatic analysis of data and presentation of results gained from such an experiment.
picketFenceAnalysis := (

  analysisCalculation[counterData_, spacing_] := Module[{
     time, distance, xyData, nlmFreefall, displacementFunction, velocityFunction, accelerationFunction
     },
    time = Take[Flatten[counterData], {2, -1, 2}];
    distance = Table[j*spacing, {j, 0, (Length[time] - 1) }];
    xyData = Thread[{time, distance}];
    nlmFreefall = NonlinearModelFit[xyData, a*z^2 + b*z + c, {a, b, c}, z];
    displacementFunction = Normal[nlmFreefall];
    velocityFunction = D[displacementFunction, z];
    accelerationFunction = D[velocityFunction, z];
    g = SetPrecision[Max[CoefficientList[accelerationFunction, z]], 4];
    userInTable = TableForm[ counterData, TableHeadings -> {None, {"Count", "Time at Event (s)"}}, TableAlignments -> Center];
    freefallResults = TableForm[xyData, TableHeadings -> {None, {"Time Elapsed (s)",  "Displacement (m)"}}, TableAlignments -> Center];

    plotSensorData = Show[
          ListPlot[xyData],
          Plot[displacementFunction, {z, time[[1]], time[[-1]]}],
          Frame -> True,
          FrameLabel -> {{"Displacemnt (m)", ""}, {"Time (s)",Style["Displacement of Body in Freefall", FontSize -> 12]}}
    ];

     plotVel = Plot[
         velocityFunction, {z, 0, time[[-1]]},
         Frame -> True,
         FrameLabel -> {{"Velocity (m/s)", ""}, {"Time (s)",
         Style["Velocity of Body in Freefall", FontSize -> 12]}}
    ];

    plotAccel = Plot[
        accelerationFunction, {z, 0, 20},
        Frame -> True,
        FrameLabel -> {{"Acceleration (m/\!\(\*SuperscriptBox[\(s\), \\(2\)]\))", ""}}];
    ];

  dataInputInterface := (
      CreateDialog[{
        Column[{
             Row[{TextCell["Picket Distance (m): "], InputField[Dynamic[spacing]] }],
             Row[{TextCell["Sensor Data: "], InputField[Dynamic[counterDataOut]] }],
             Row[{CancelButton[], DefaultButton[analysisCalculation[counterDataOut, spacing]; returnAnalysis] }]
         }]
       }];
    );

  returnAnalysis := DialogReturn[{
    CreateDocument[{
         Grid[{
            {Button["Save", NotebookSave[]], Button["Exit", DialogReturn[]]}
            }],
         TextCell[freefallResults],
         GraphicsRow[
             {plotSensorData, plotVel, plotAccel},
              ImageSize -> Full, Frame -> True],
             TextCell[Quantity[g, "m/s^2"], FontSize -> 12]
         }]
     }];

  dataInputInterface;

  );
The results from the experiment were exported as PicketFenceFreefall.dat and is included in the project folder.
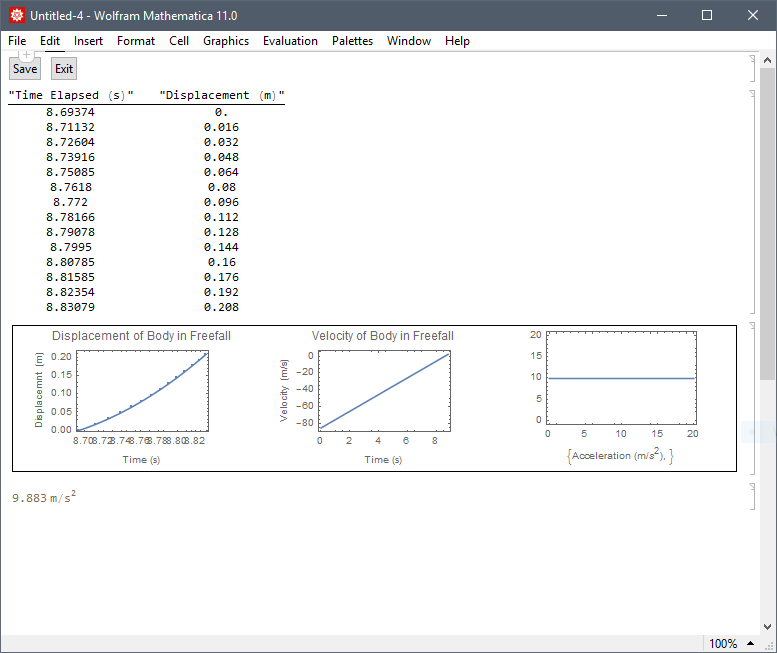
The result is within 0.7% of the accepted value of acceleration due to freefall at 9.81 ms^-2.
The sampling rate of the screen capture was too slow to see but the photogate data appears live on the console with very little latency - not in the way that it appears in the animation.
The best improvements are to firstly make the next version with the microcontroller integrated into the photogate device as one single unit. Secondly, the output generated by the op amp trigger isn't fully TTL compatible;. the high output signal measures at an acceptable 3.52 V (within acceptable TTL limits and registers on a logic probe) but the low voltage is 1.51 V which is much too high for TTL (and borderline for the Arduino). In addition to these fixes, an option to have a master/slave configuration between two photogates would be implemented and also some additonal hardware such as mode indicator and toggle button. The software is pretty limited but the core functionality works as intended. The serial link is indiscriminate so an additional step could be carried out where the hardware identifies itself as the expected device when establishing the link - could be useful if using more than one serial port. More analysis options could also be added.
In conclusion, the project as it stands is pretty much what I had intended when I first began it and is ready for the next iteration of improvements.