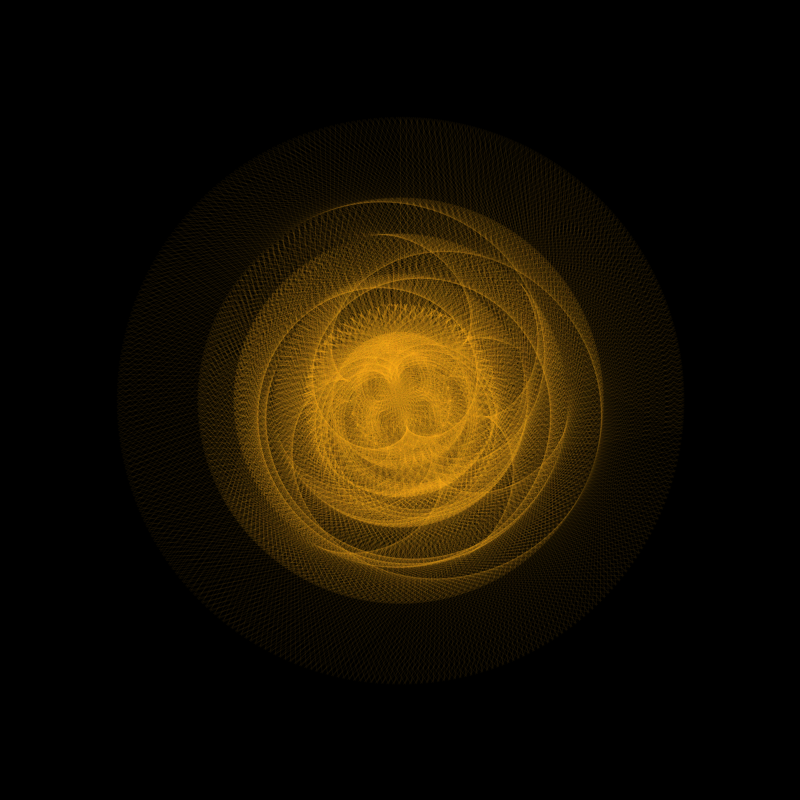
While investigating the TRAPPIST-1 exoplanet system in WL, I found this very cool looking mandala pattern that arises by connecting lines between the 7 planets in the system, and iterating time in discrete steps.
Get the list of exoplanets around TRAPPIST-1:
sats = Entity["Star", "TRAPPISTMinus1"]["Satellites"];
Get the orbital periods of the exoplanets in hours:
pers = QuantityMagnitude[EntityValue[sats, "OrbitPeriod"], "Hours"]

{36.2857357, 58.1635700, 97.2572, 146.4910, 221.112, 296.6736, 5.*10^2}
Get the semimajor axes of the orbits in AUs:
rads = QuantityMagnitude[EntityValue[sats, "SemimajorAxis"],
  "AstronomicalUnit"]

{0.011110, 0.015210, 0.021440, 0.028170, 0.0371, 0.0451, 0.063}
Normalize the periods are orbit distances with respect to the inner-most planet
radrats = rads/rads[[1]]

{1.0000, 1.3690, 1.9298, 2.5356, 3.34, 4.06, 5.7}

rats = pers/pers[[1]]

{1.00000000, 1.60293209, 2.68032, 4.037152, 6.09363, 8.176040, 1.*10^1}
Create the mandala:
Graphics[{RGBColor[1, .7, .1], Thickness[0.001], Opacity[0.05],
  Table[{Line[Append[#, First[#]]] & /@
     Partition[
      MapIndexed[{radrats[[First[#2]]] Sin[1/#1 t],
         radrats[[First[#2]]] Cos[1/#1 t]} &, rats], 3, 1]}, {t, 0, 60 Pi,
    2 Pi/24.}]}, ImageSize -> 800, PlotRange -> 8, Background -> Black]