I'm trying to do a Machine Learning using old data. However, the data are not numeric-data but graph-image-data. So I create the tool which calculates numeric-data from graph-image-data.
Goal
The left is the original graph-image-data. The right is the graph made from the tool's output(list data). 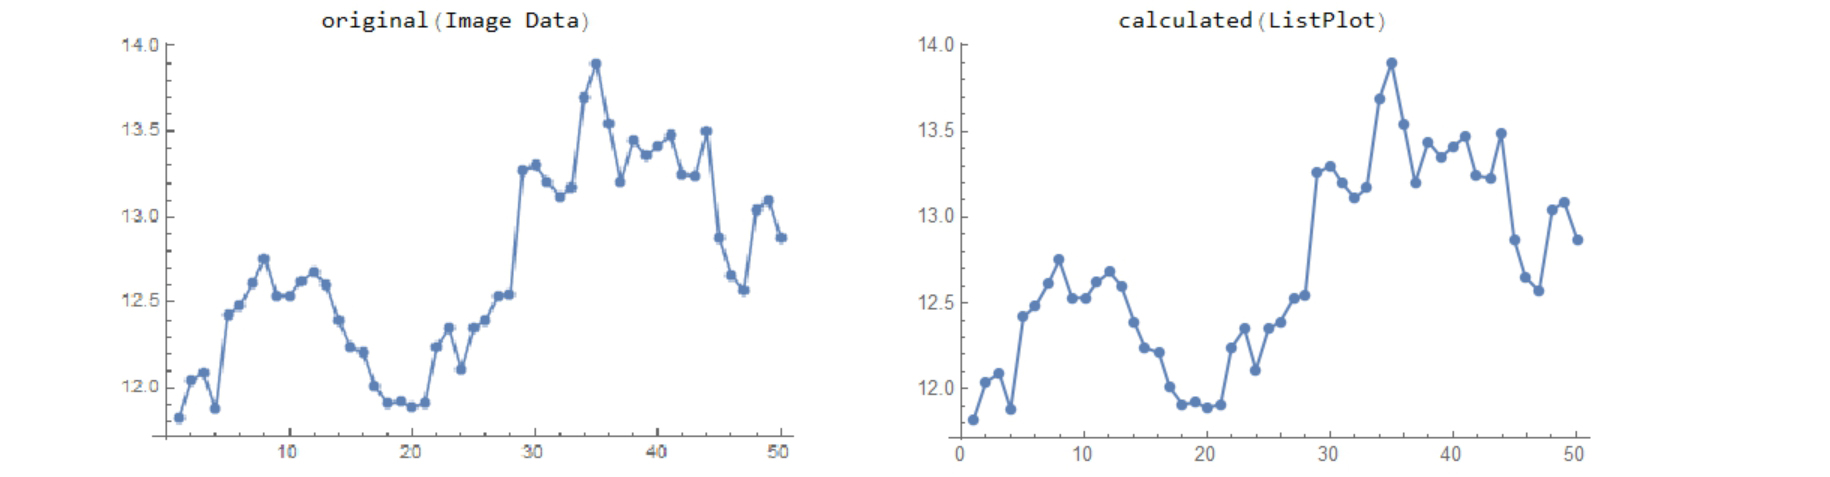
1     2     3     4     5     6     7     8     9     10    11    12    13    14    15    16    17    18    19    20    21    22    23    24    25    26    27    28    29    30    31    32    33    34    35    36    37    38    39    40    41    42    43    44    45    46    47    48    49    50
11.82 12.04 12.09 11.88 12.42 12.48 12.61 12.75 12.53 12.53 12.62 12.68 12.6  12.39 12.24 12.21 12.01 11.91 11.92 11.89 11.91 12.24 12.35 12.11 12.35 12.39 12.53 12.54 13.26 13.3  13.20 13.11 13.17 13.69 13.9  13.54 13.20 13.44 13.35 13.41 13.47 13.24 13.23 13.49 12.87 12.65 12.57 13.04 13.09 12.87
The tool comes in two steps
Step 1
In the first step, the tool selects points of the graph roughly by using ImageKeypoints function. However, it also uses masking option of ImageKeypoints because ImageKeypoints sometimes selects unnecessary points of the graph. I referred to @Vitaliy Kaurov 's post about how to make masking area.
My GetPoints function selects the key points of the graph.
GetPoints[i_] := Manipulate[
  Grid[{
    {"Mask(add/del alt+click/cmd+click?", "Selected Points"},
    {Show[i, ImageSize -> ImageDimensions[i]],
     mask =
      Graphics[Disk[#, 10] & /@ p,
       PlotRange -> Thread[{{1, 1}, ImageDimensions[i]}],
       ImageSize -> ImageDimensions[i]];
     HighlightImage[i,
      points =
       ImageKeypoints[i, MaxFeatures -> n, Method -> method,
        Masking -> mask], ImageSize -> ImageDimensions[i]]}
    }],
  {{p, {ImageDimensions[i]/2}}, Locator, LocatorAutoCreate -> True,
   Appearance -> Style["\[EmptyCircle]", Red, 30]}, {{n, 100,
    "number of points"}, 10, 300,
   10}, {{method, "FAST"}, {"AGAST", "AKAZE", "BRISK", "FAST", "KAZE",
     "ORB", "SURF"}, ControlType -> RadioButton},
  ControlPlacement -> {Top}]
Here is an original data, or graph-image-data. This is a financial graph. 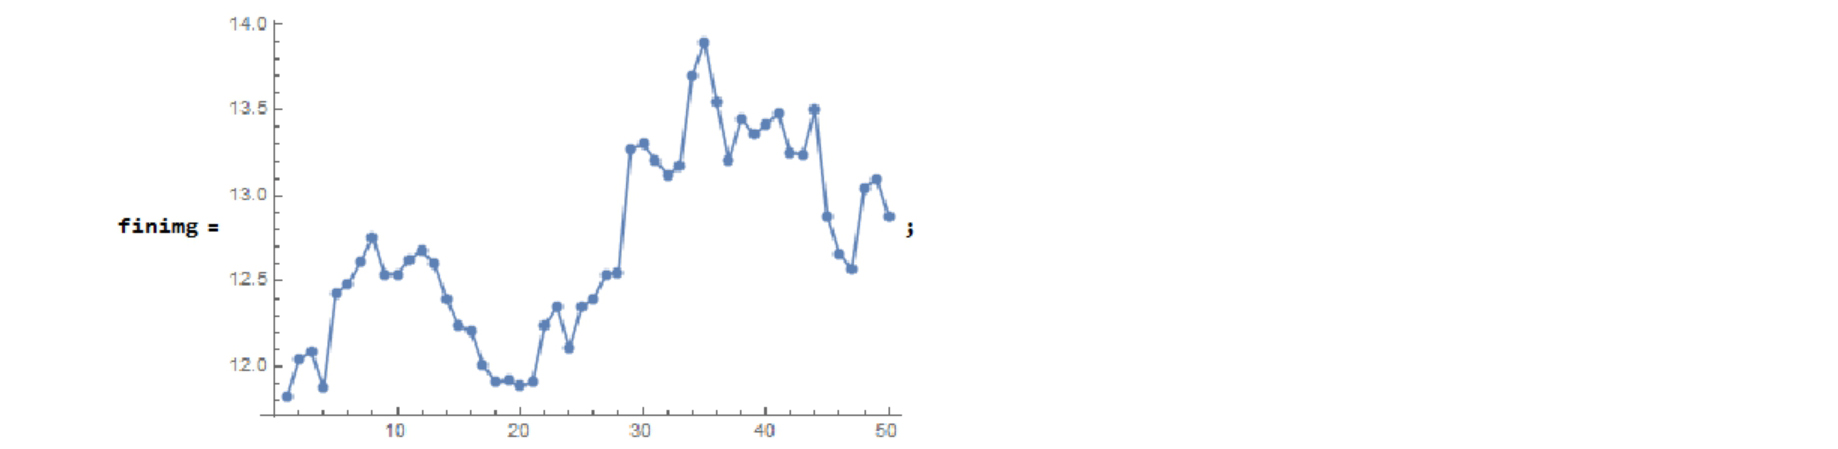
The red points in the right figure are selected points. 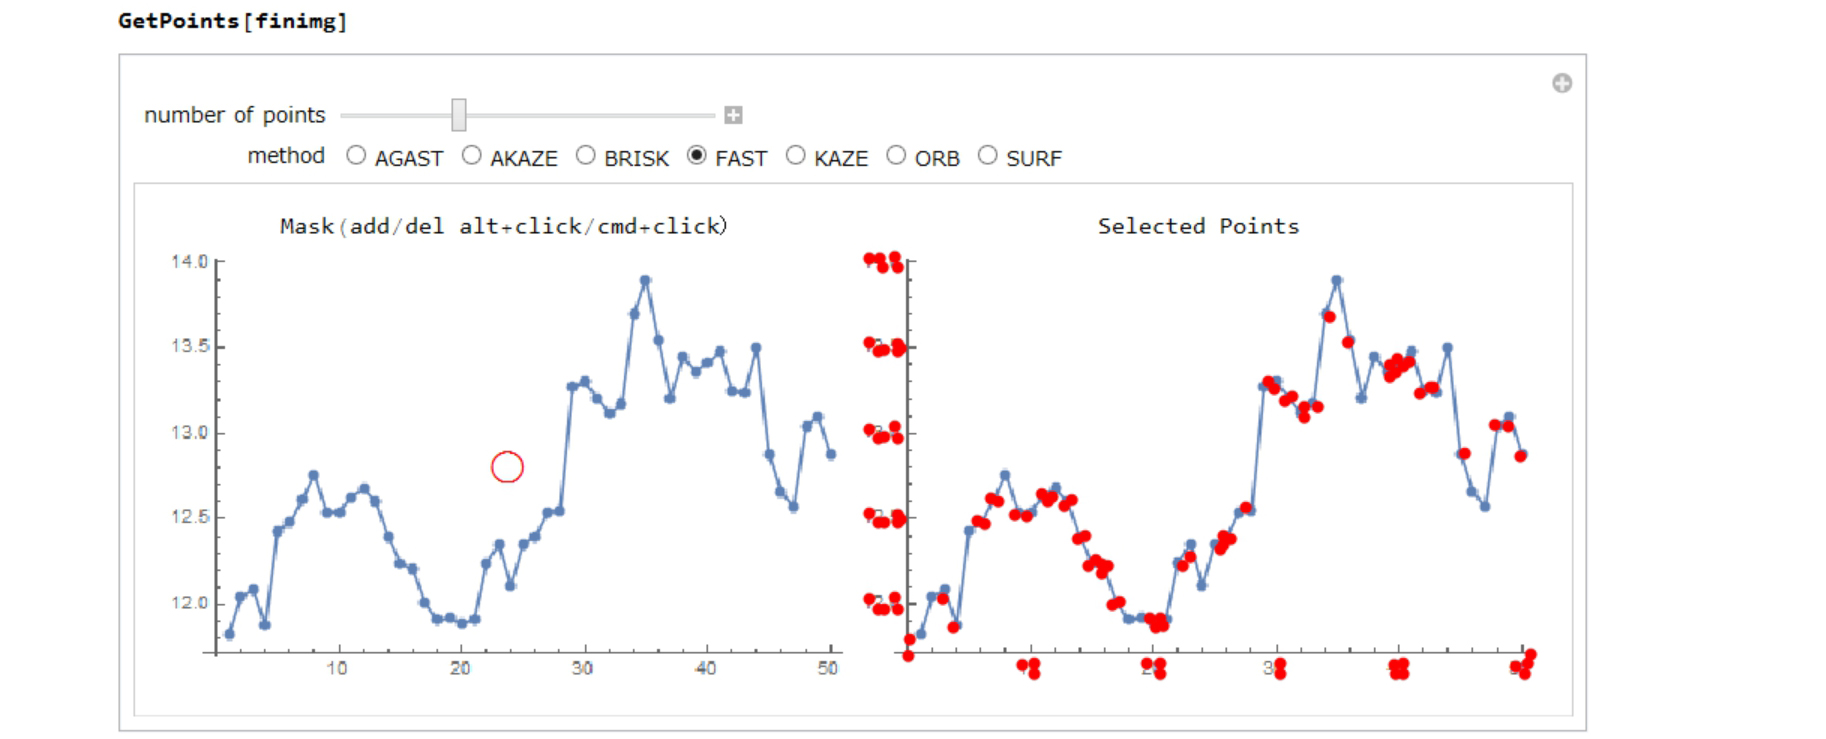
Some ticks may be selected, but they are unnecessary. You can mask them by moving the red circle in the left figure. 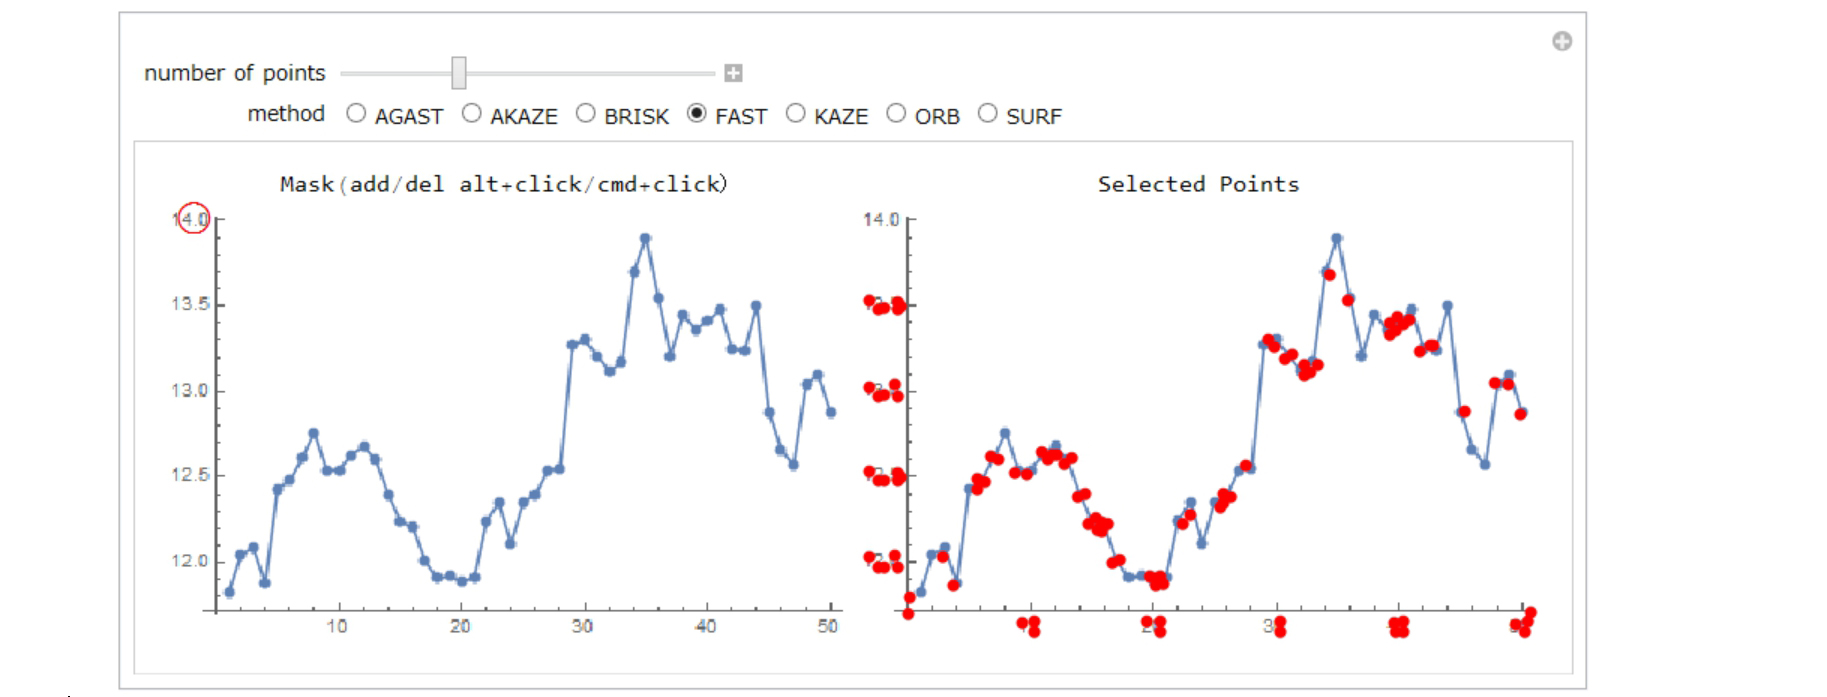
You can add more masking areas with alt+click(WINDOWS)/cmd+click(MAC). 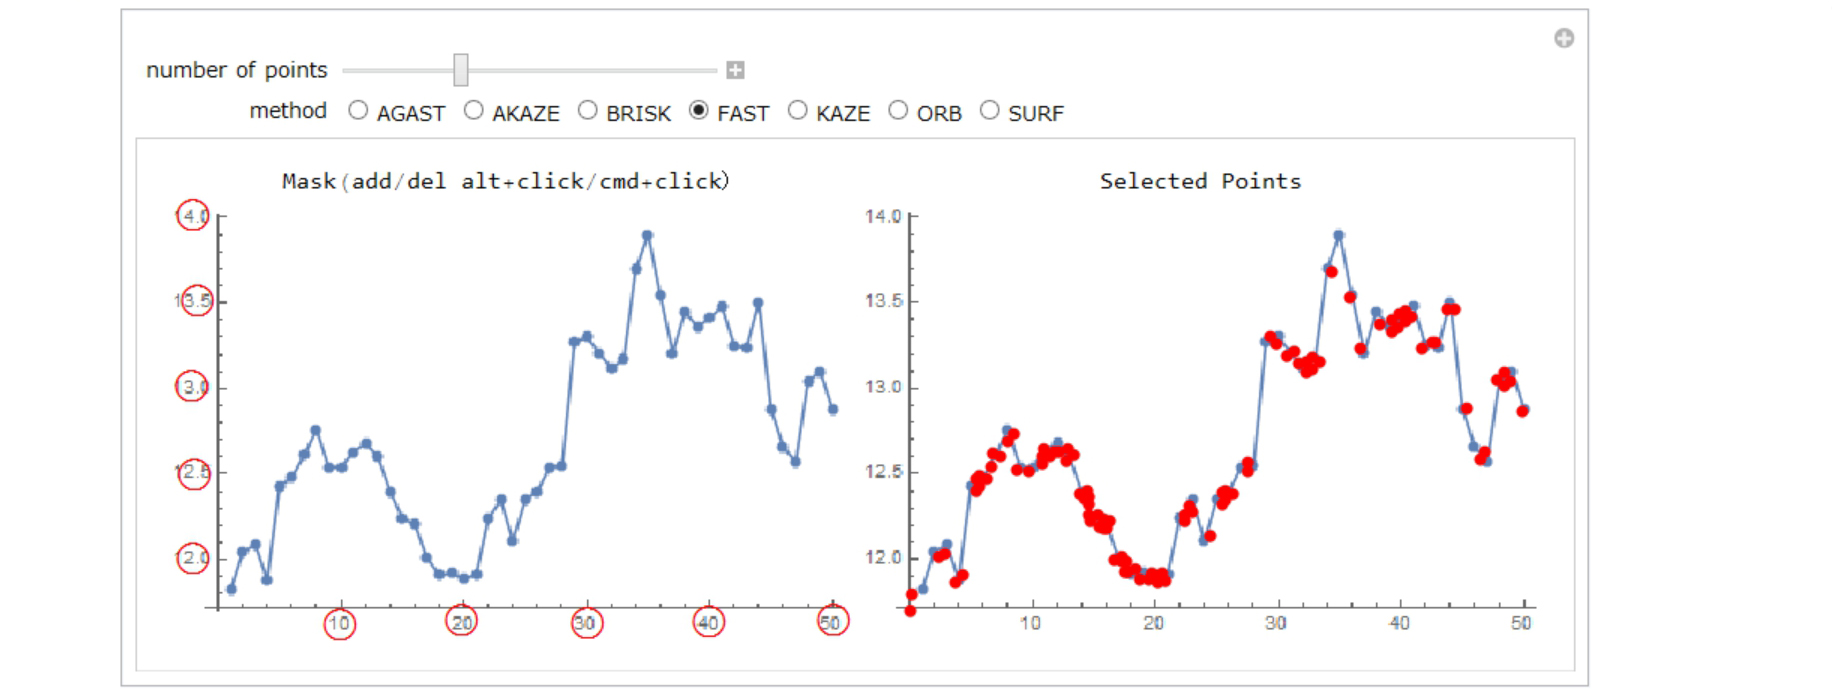
ImageKeypoints has many methods. In this case, "AKAZE" method is the best. 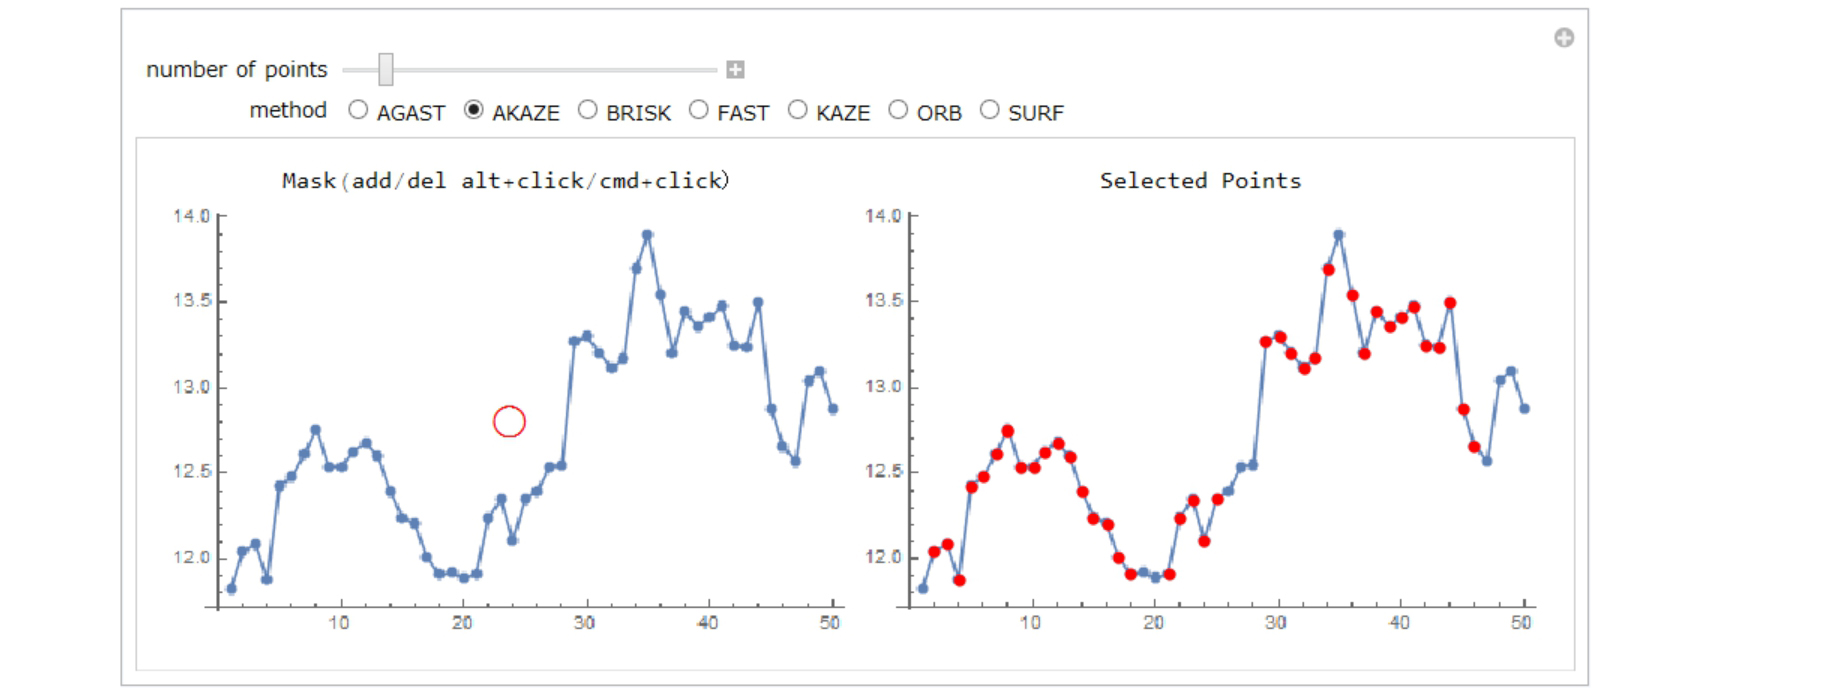
Forty points are selected. They are stored in "points". 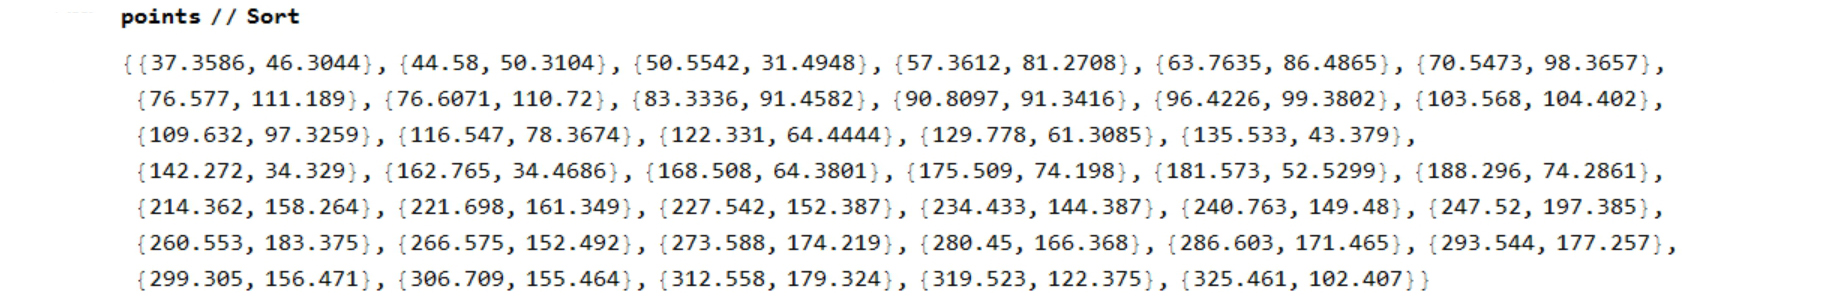
Step 2
In this step, My GetList function makes list of selects the points.
GetList[i_, points_] := Module[{}, ClearAll[list]; list = {};
  Row[{Manipulate[Grid[{{"Selected Points", "Sample List"},
       {Show[i, Graphics[{Point[u]}],
         ImageSize -> ImageDimensions[i]],
        Dynamic[If[(ValueQ[list] == False) || (list == {}),
          "1? move bottom-left and upper-right red points\n2. set \
each coordinate\n3. add/del points if necessary(alt+click/cmd+click?\n\
4. click Calculate button", list = Round[#, accuracy] & /@ list;
          Sort[RandomSample[list, UpTo[10]]] // TableForm]]}}],
     Row[{Dynamic[u[[1]]], "->",
       Control[{coordinate1, {{0, 0}}, InputField, ImageSize -> 80}],
       Dynamic[u[[2]]], "->",
       Control[{coordinate2, {{1, 1}}, InputField, ImageSize -> 80}],
       Control[{{accuracy, 0.01}, InputField, ImageSize -> 50}]},
      "  "],
     Row[{Button["Calculate",
        list = locator2coordinate[u, {coordinate1, coordinate2}];,
        ImageSize -> 120]}, "  "],
     Row[{Button["Clear points", u = Take[u, 2]; Put[u, "locator"],
        ImageSize -> 120]}, "  "],
     {{u, Join[{{1, 1}, ImageDimensions[i] - {1, 1}}, Sort[points]]},
      Locator, LocatorAutoCreate -> True,
      Appearance -> Style["\[FilledCircle]", Red, 8]},
     ControlPlacement -> {Bottom, Bottom}]
    }, "  "]
  ]

locator2coordinate[list_, sample_] :=
 Module[{a, b, c, d, mat, cnst, solve, matx, cnstx},
  mat = {{a, 0}, {0, d}}; cnst = {b, c};
  solve =
   Solve[mat.list[[1]] + cnst == sample[[1]] &&
     mat.list[[2]] + cnst == sample[[2]], {a, b, c, d}];
  matx = mat /. solve; cnstx = cnst /. solve;
  Partition[Flatten[(matx.# + cnstx) & /@ list], 2] // Sort
  ]
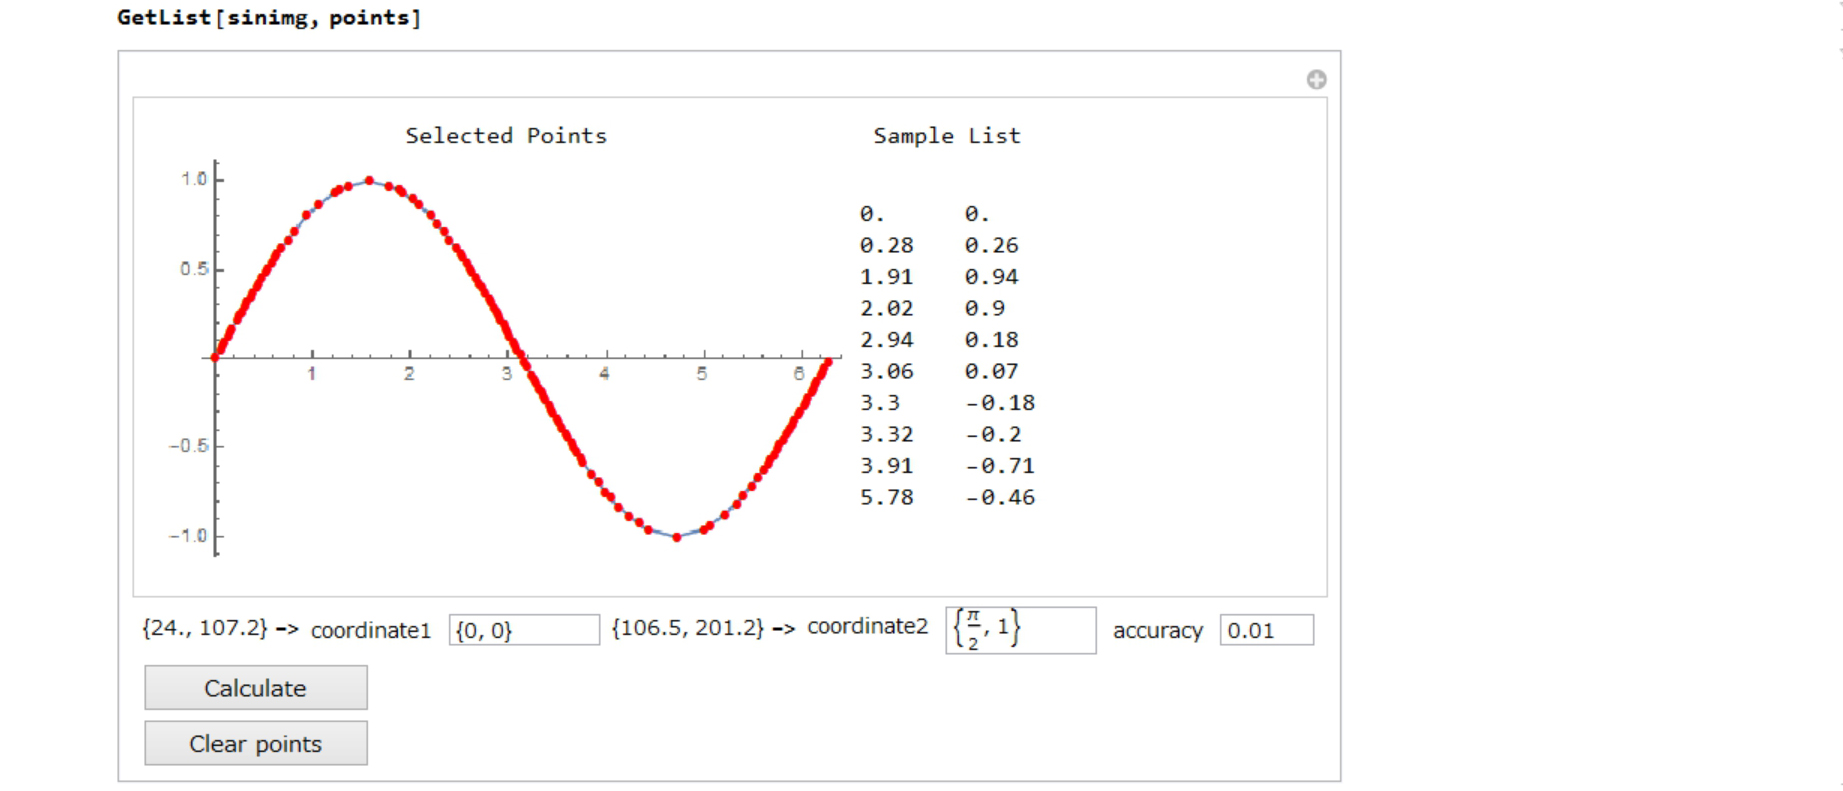
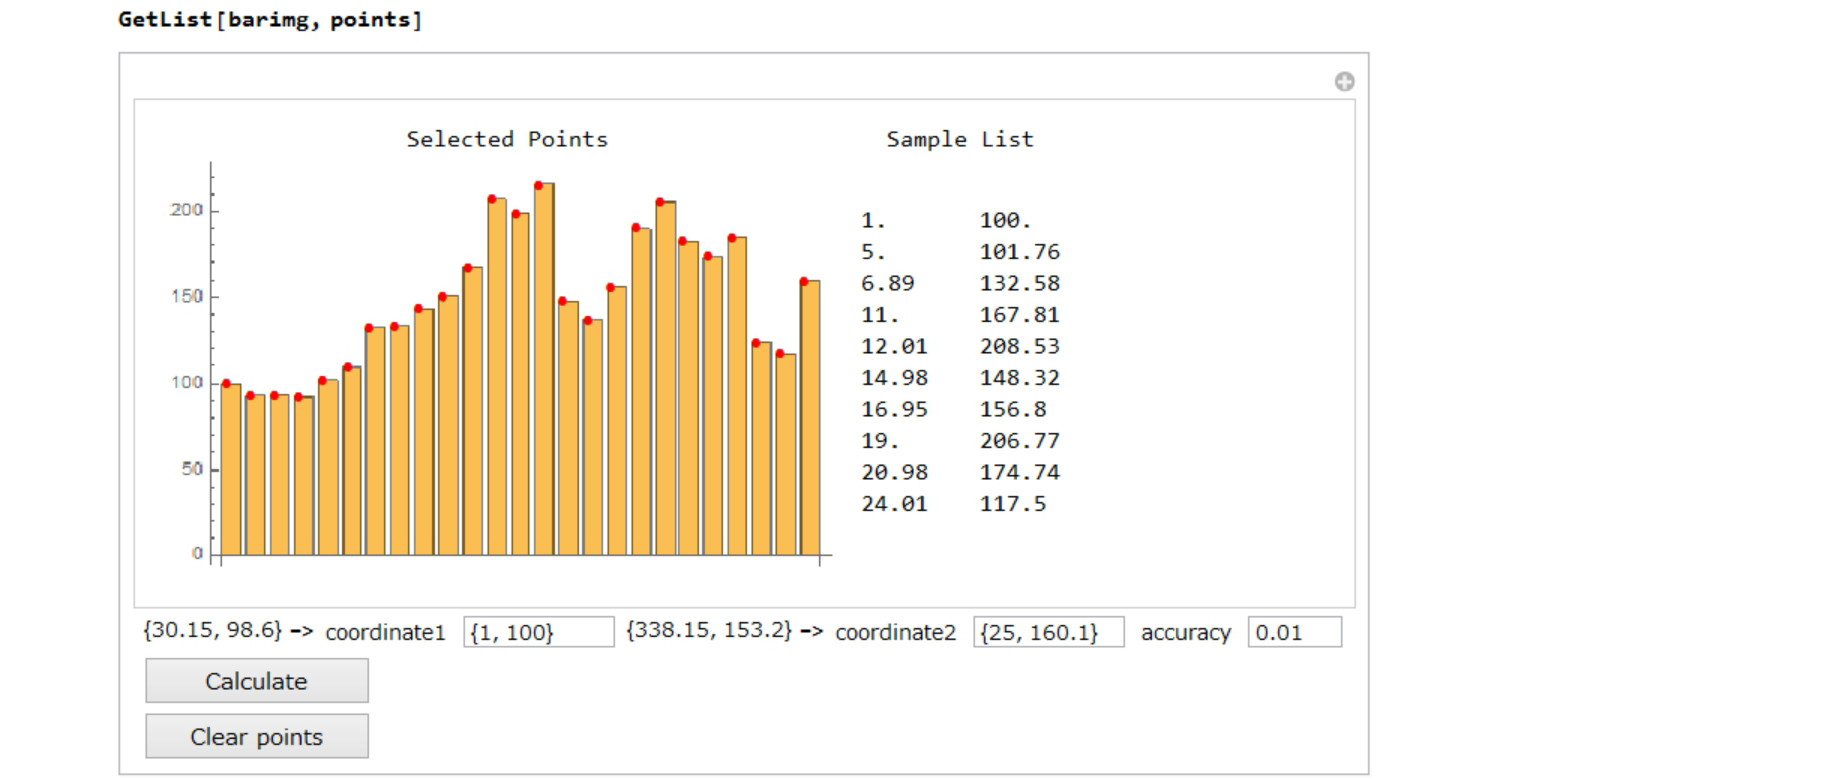
You can make list in the next process.
Move bottom-left and upper-right red points into where you know the coordinates 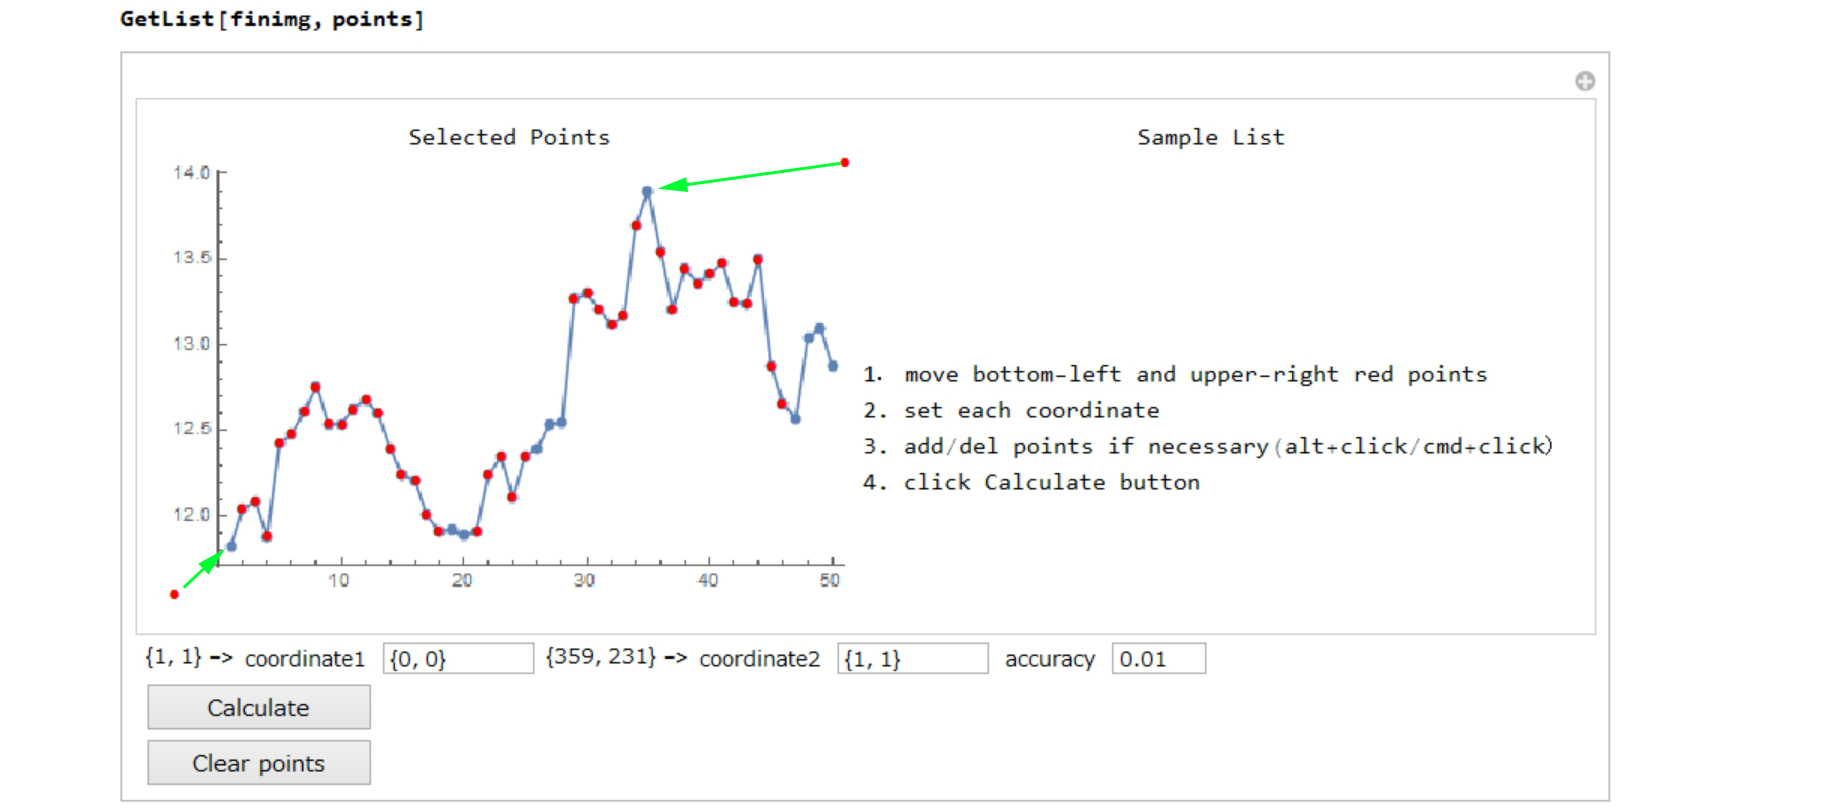
Set each coordinate
Add points with alt+click(WINDOWS)/cmd+click(MAC)
50 points are selected in the figure below. 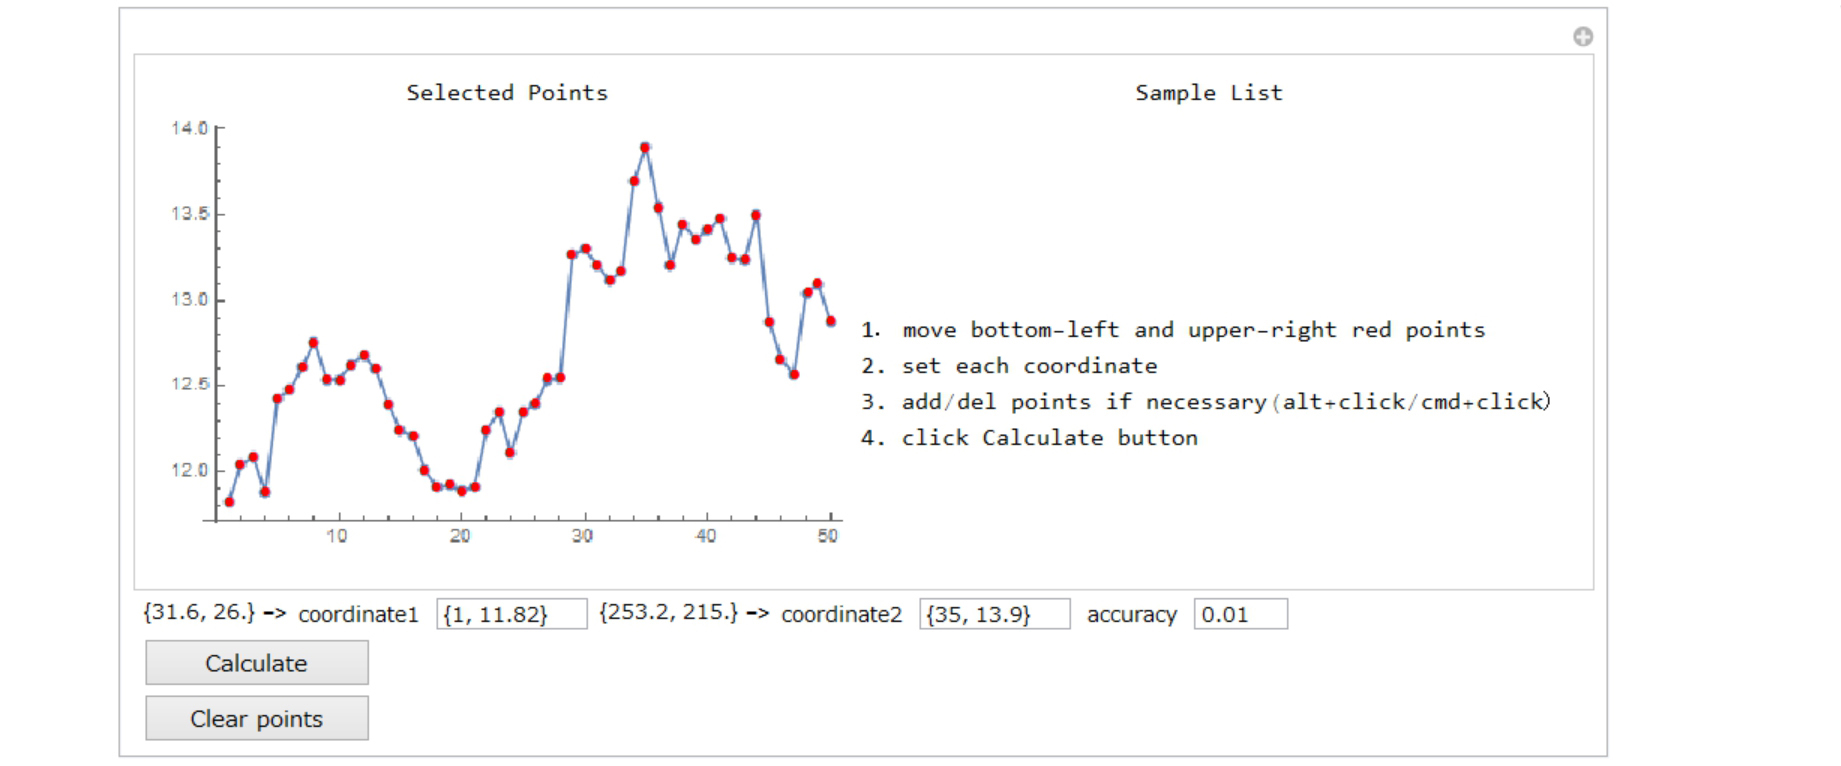
Click Calculate button
The summary is displayed in the right. 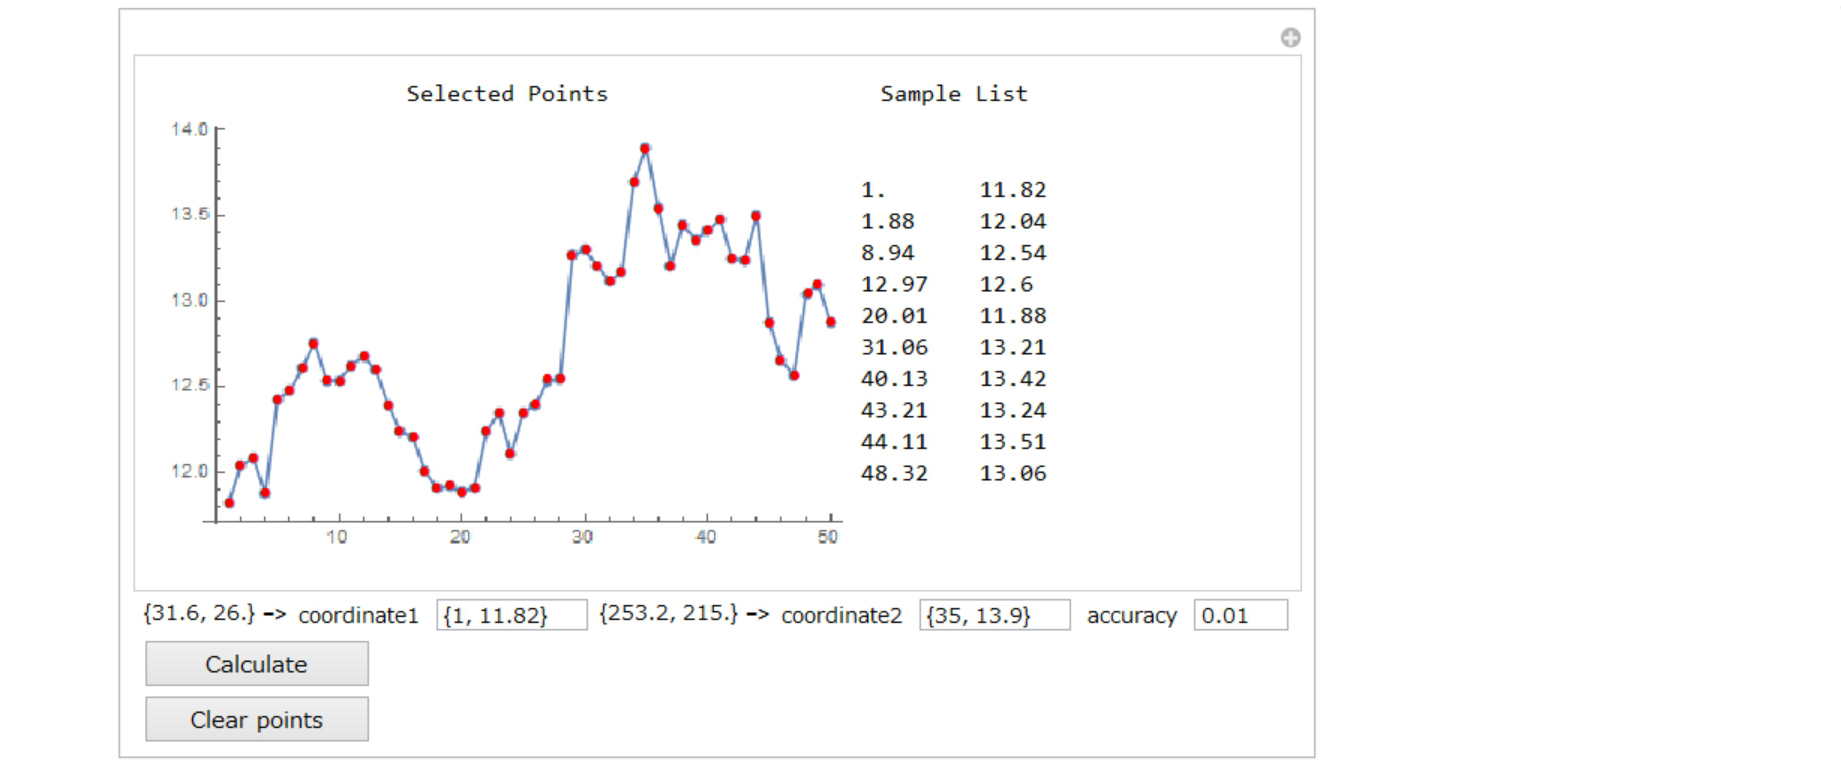
And the selected points are stored in "list".
Transpose[{Round[#[[1]], 1], #[[2]]} & /@ list] // TableForm
1     2     3     4     5     6     7     8     9     10    11    12    13    14    15    16    17    18    19    20    21    22    23    24    25    26    27    28    29    30    31    32    33    34    35    36    37    38    39    40    41    42    43    44    45    46    47    48    49    50
11.82 12.04 12.09 11.88 12.42 12.48 12.61 12.75 12.53 12.53 12.62 12.68 12.6  12.39 12.24 12.21 12.01 11.91 11.92 11.89 11.91 12.24 12.35 12.11 12.35 12.39 12.53 12.54 13.26 13.3  13.20 13.11 13.17 13.69 13.9  13.54 13.20 13.44 13.35 13.41 13.47 13.24 13.23 13.49 12.87 12.65 12.57 13.04 13.09 12.87
Compare the original graph image and calculated graph(ListPlot). 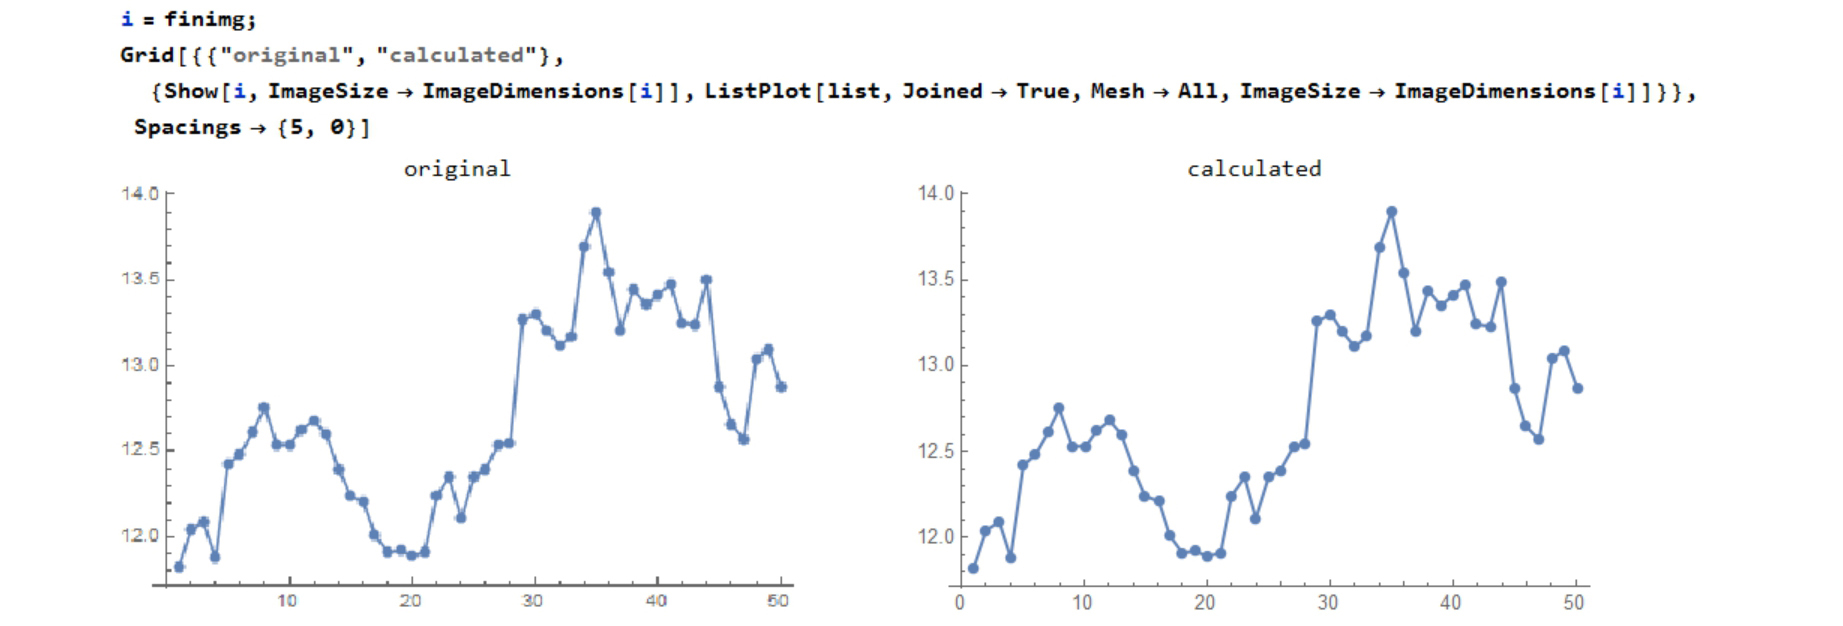
Example 1
Here is a graph-image-data like sin curve. 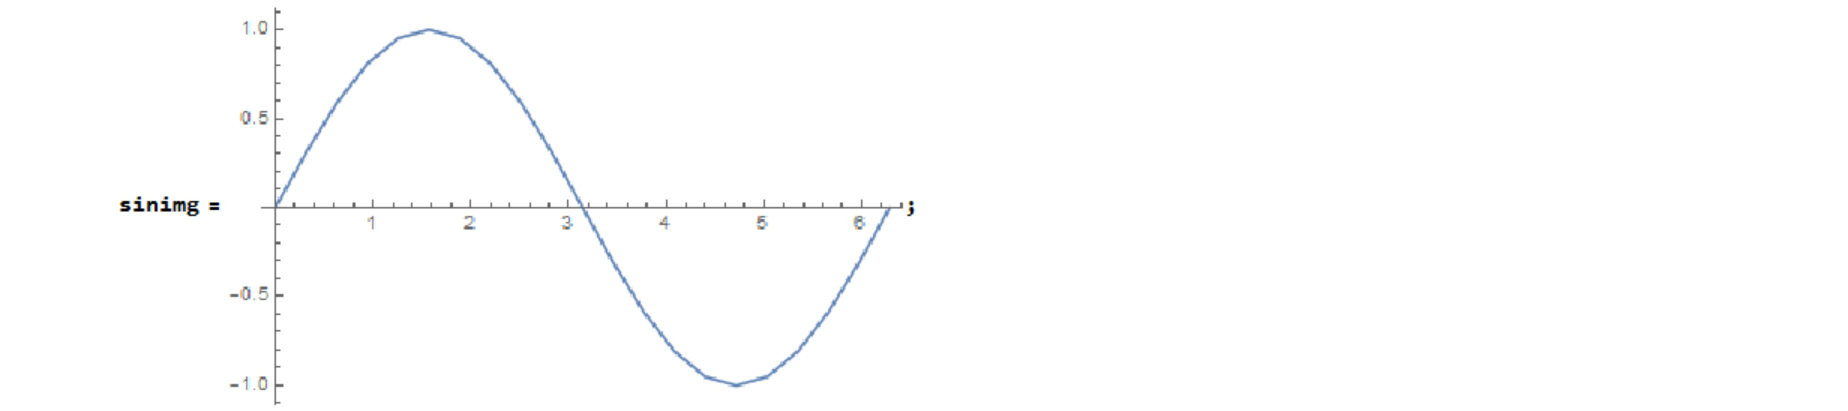
Step 1: GetPoints In this case, "FAST" method is the best. 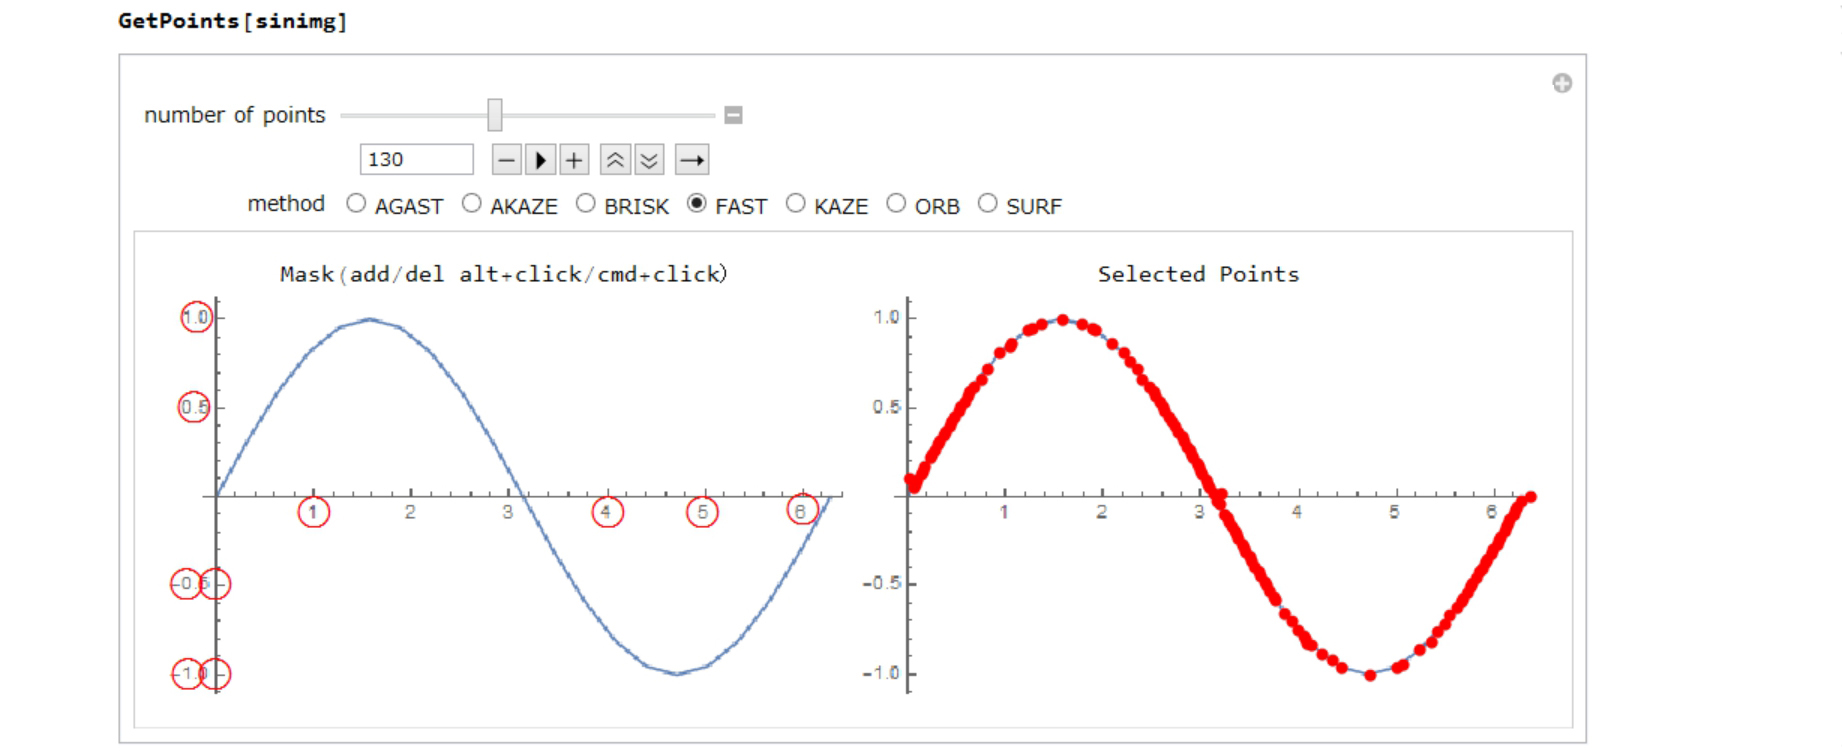
Step 2: GetList
Compare the original graph image and calculated graph(ListPlot). 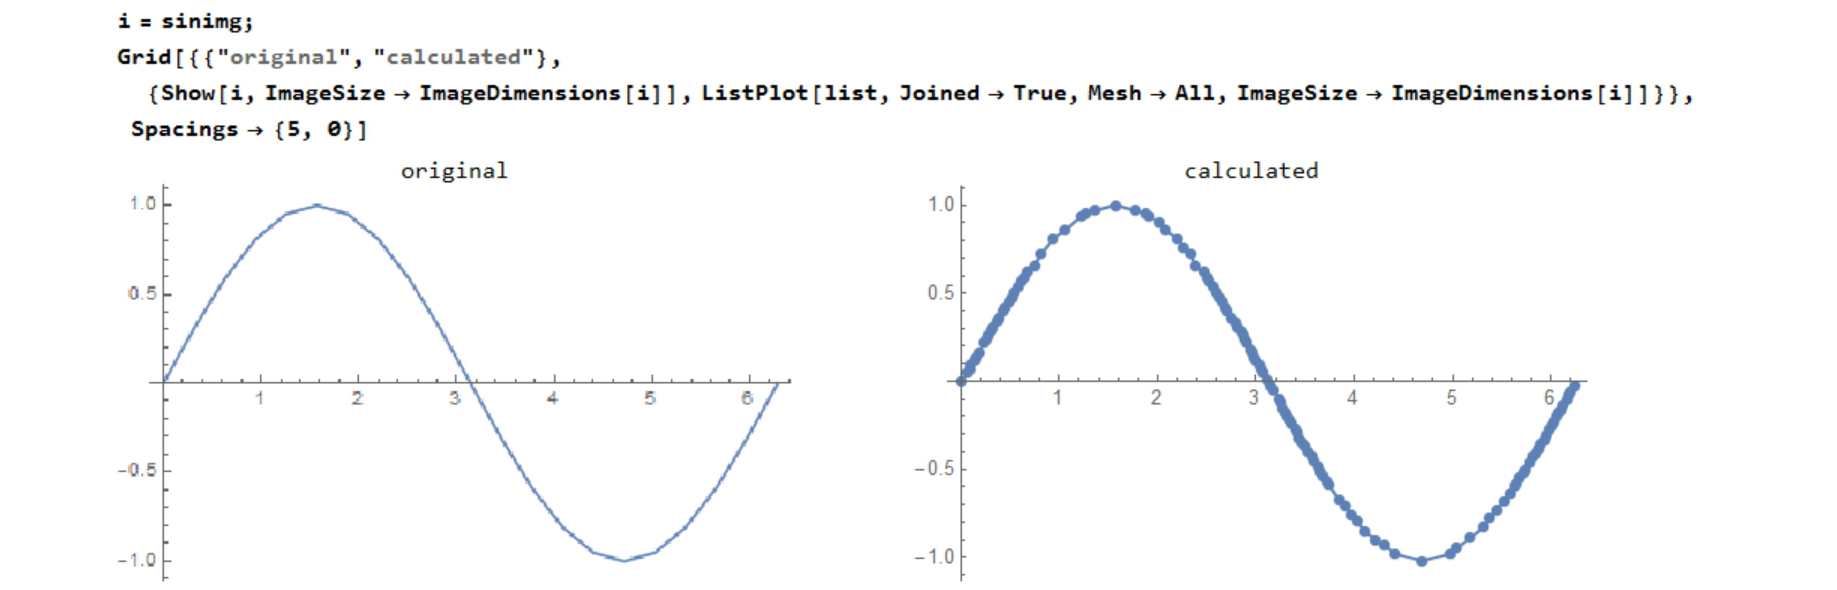
Example 2
Here is a graph-image-data like barchart. 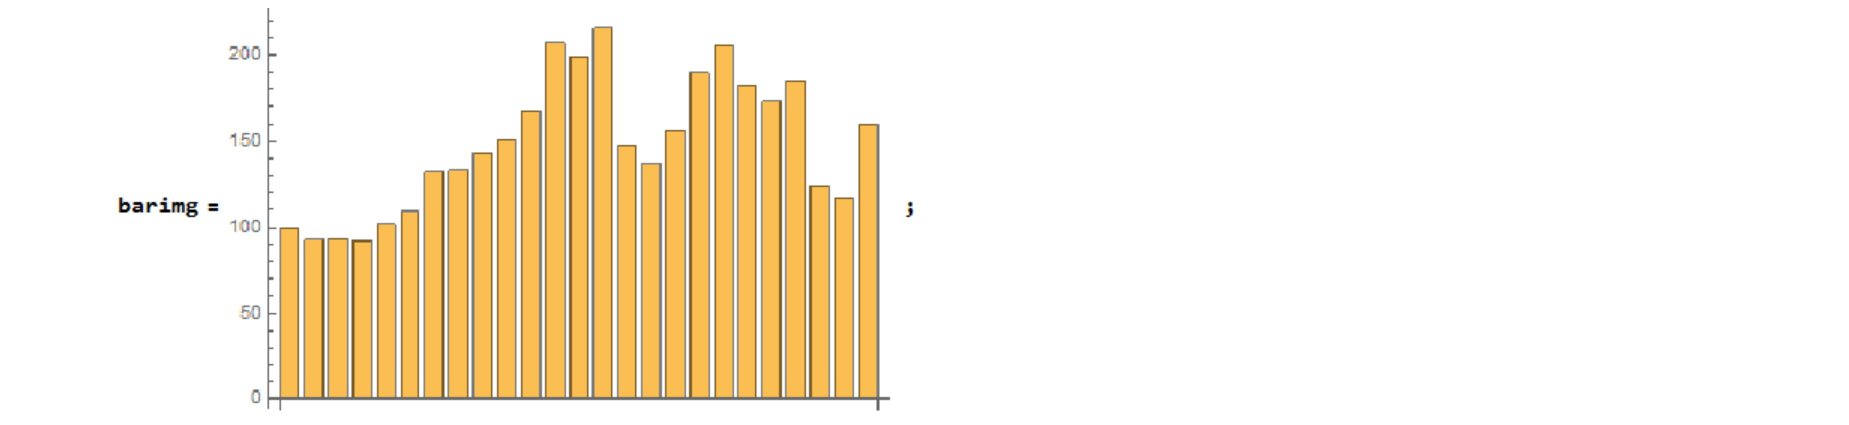
Step 1: GetPoints In this case, "AGAST" method is the best. 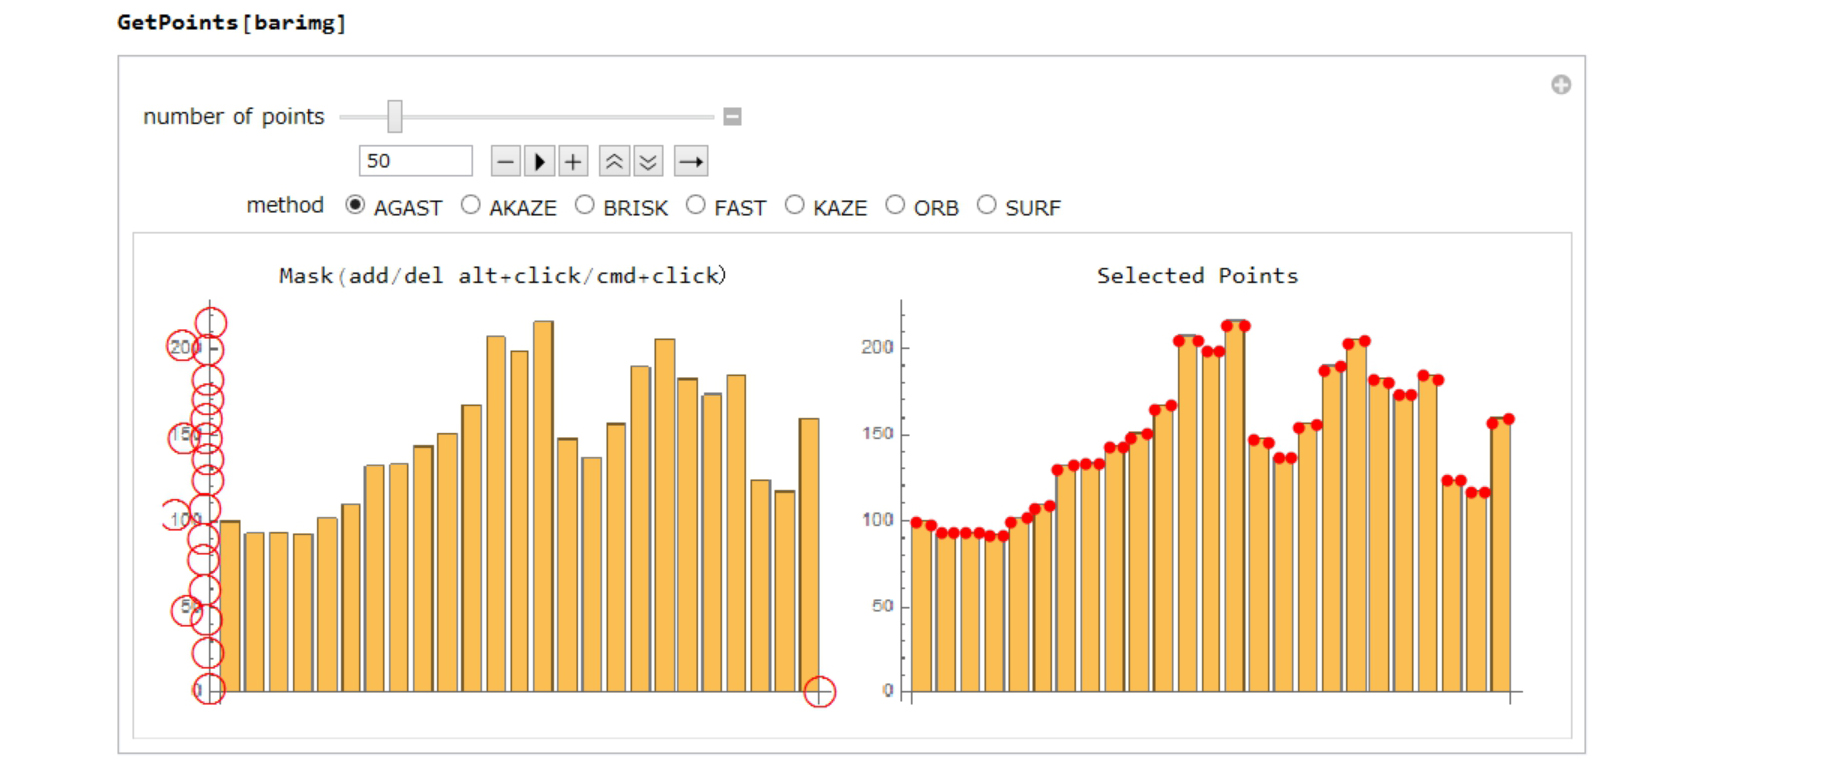
Step 2: GetList
Compare the original graph image and calculated graph(BarcChart). Now I have numeric data, so I can set a bar style. 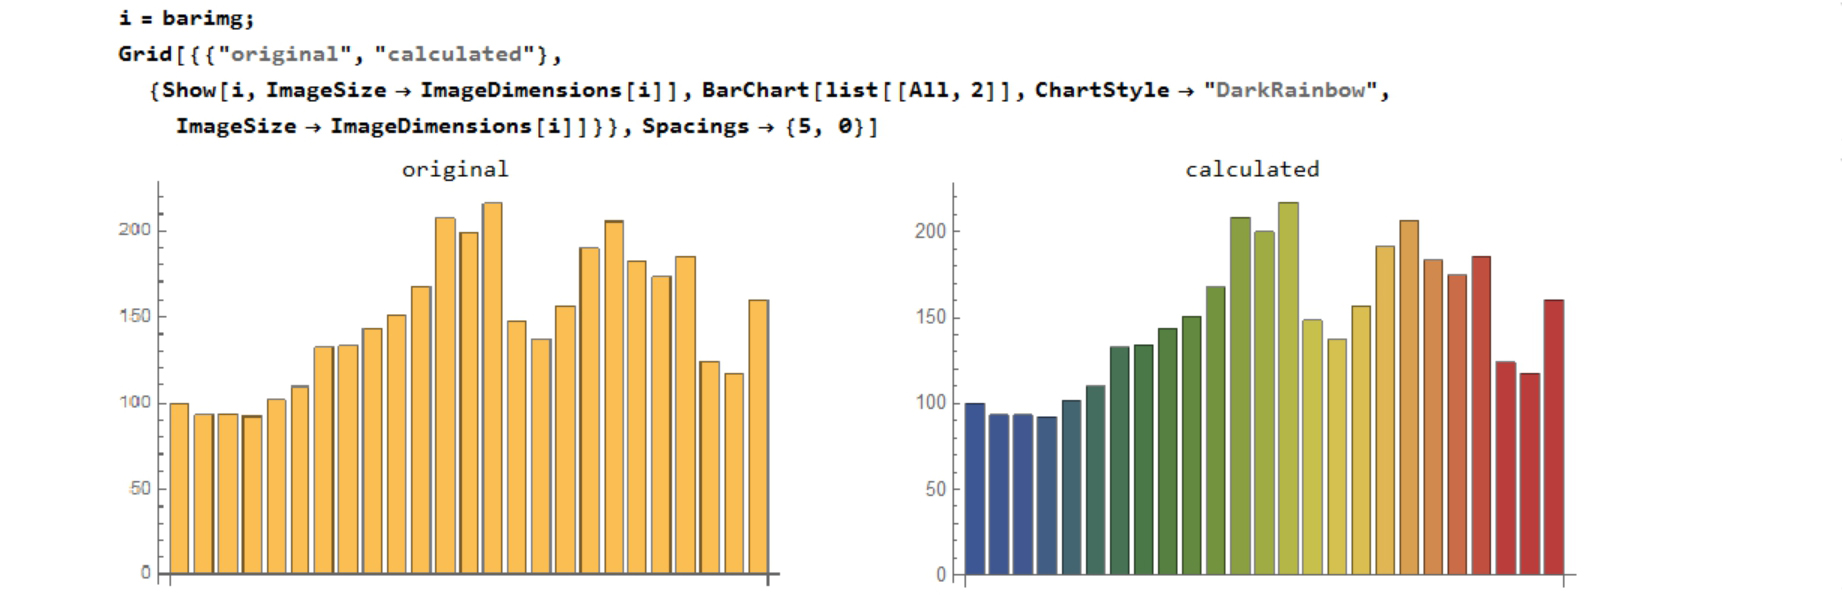
Finally
In this approach, some manual operations are necessary. When there are a lot of image data, this work will be very boring. There are many many functions in Wolfram Language. By using ImageGraphics, ImageCorners, it may be able to improve the accuracy of selecting points in Step 1. By using TextRecognize, it may be unnecessary to set the coordinates manual setting in Step 2.


