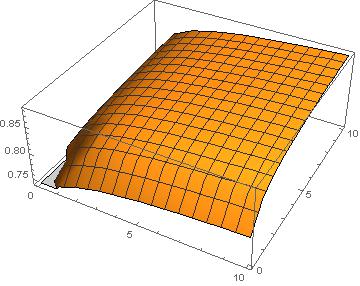
Group Abstract Group Abstract

Message Boards Message Boards

0
|
8.2K Views
|
5 Replies
|
0 Total Likes
View groups...
Share
Share this post:

[?] Plot 3D a matrix using ListPlot3D or Histogram3D?

Posted 9 years ago

I have the matrix

a={
{0.709,0.748,0.761,0.770,0.775,0.780,0.783,0.786,0.788,0.790,0.791},
{0.622,0.789,0.803,0.813,0.818,0.823,0.826,0.829,0.831,0.834,0.835},
{0.762,0.803,0.818,0.827,0.833,0.838,0.841,0.844,0.846,0.849,0.850},
{0.770,0.812,0.827,0.837,0.842,0.847,0.850,0.854,0.856,0.858,0.860},
{0.776,0.818,0.833,0.842,0.848,0.853,0.856,0.859,0.861,0.864,0.865},
{0.780,0.822,0.837,0.846,0.852,0.858,0.861,0.865,0.867,0.869,0.870},
{0.783,0.826,0.841,0.850,0.856,0.860,0.864,0.868,0.870,0.872,0.874},
{0.786,0.828,0.844,0.853,0.859,0.863,0.867,0.871,0.873,0.876,0.877},
{0.788,0.831,0.846,0.855,0.861,0.866,0.869,0.872,0.875,0.876,0.879},
{0.790,0.833,0.848,0.857,0.863,0.868,0.872,0.875,0.877,0.881,0.882},
{0.792,0.834,0.850,0.859,0.865,0.870,0.873,0.876,0.879,0.881,0.883}}

how to plot this matrix in 3D i and j varie to 0 and 10 i tried

ListPlot3D[a, DataRange -> {{0, 10}, {0, 10}}]           

and I found

enter image description here

How little I trace in Histogram3D ?

POSTED BY: n n
5 Replies

Maybe you can add labels and change the point of view to highlight the fact that the value of the matrix increases with i and j:

ListPlot3D[a, DataRange -> {{0, 10}, {0, 10}}, 
 InterpolationOrder -> 0, Filling -> Bottom, 
 AxesLabel -> {i, j, None}, ViewPoint -> {-1.5, -2, 2}]

By the way, there may be an error in the first value in the second column.

POSTED BY: Gianluca Gorni

@n n Your posts come out empty because you do not edit properly your code. Do you see the difference in how Gianluca Gorni code looks - framed and colored? Please EDIT your posts to improve formatting, do NOT make duplicate posts. Edit them according this tutorial: https://wolfr.am/READ-1ST This is how yor code should look - framed and colored:

ListPlot3D[a, DataRange -> {{0, 10}, {0, 10}}, 
InterpolationOrder -> 0, Filling -> Bottom]
POSTED BY: EDITORIAL BOARD
Posted 9 years ago

With your code I got this graph, but the matrix it is values of energy that increases as i and j increases then what is the proper graph for shows the increase in energy values with the increase of i And j

ListPlot3D[a, DataRange -> {{0, 10}, {0, 10}},InterpolationOrder -> 0, Filling -> Bottom]                                                                                                                             

enter image description here

POSTED BY: n n
POSTED BY: EDITORIAL BOARD

Perhaps you want something like this:

ListPlot3D[a, DataRange -> {{0, 10}, {0, 10}}, 
 InterpolationOrder -> 0, Filling -> Bottom]
POSTED BY: Gianluca Gorni
Reply to this discussion
Community posts can be styled and formatted using the Markdown syntax.
Reply Preview
Attachments
Remove
or Discard