I have found an example in the documentation of Mathematica. I tried to modify the code as a way of learning. Fortunately, I've done what I expected only if a little problem is solved, I need help :
Here is the original code :
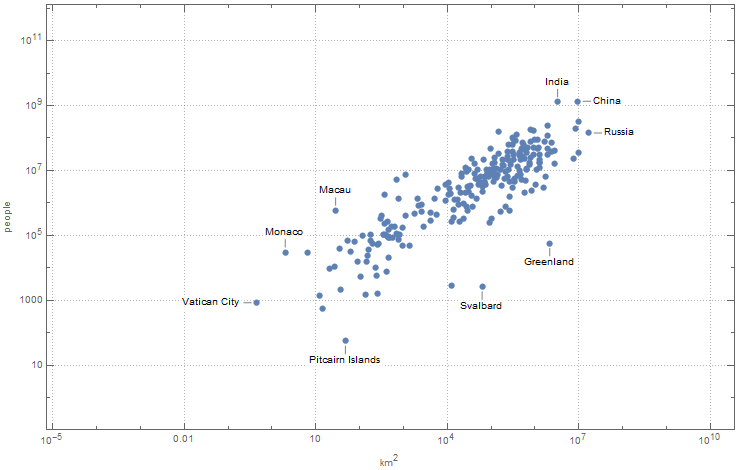
In[1]:= datta = EntityValue[
   EntityClass["Country", "Countries"], {"Name", "Area","Population"}];

In[2]:=annotated = data /. {{n : "Macau" | "Monaco" | "India", a_, b_} :> Callout[{a, b}, n, Above],
       {n : "Pitcairn Islands" | "Svalbard" | "Greenland", a_,b_} :> Callout[{a, b}, n, Below],
       {r : "Russia" | "China", a_, b_} :> Callout[{a, b}, r, After],
       {"Vatican City", a_, b_} :> Callout[{a, b}, "Vatican City", Before],
       {n_, a_, b_} :> Tooltip[{a, b}, n]}

In[3]:=ListLogLogPlot[annotated, PlotTheme -> "Detailed", FrameLabel -> Automatic]
I wanted to modify In[2] , here is my code:
annotated1 =
  data /. MapThread[{#1, a_, b_} :> #2[{a, b}, n, #3] &,
     {
     {n : "Macau" | "Monaco" | "India",
      n : "Pitcairn Islands" | "Svalbard" | "Greenland",
      n : "Russia" | "China", n : "Vatican City", n_},
     {Callout,Callout, Callout, Callout, Tooltip},
     {Above, Below, After,Before, **Blank**}
    }];
the problem is that Tooltip function cannot accept a third argument :
Tooltip[expr,label]
,though MapThread cannot accept a list with inferior dimension:
**Lists must be of the same dimension.**


