Hello Lea,
you could do it in the following way: starting from your data
data = {{1, 4.008668526800082`}, {2, 13.840674130266803`}, {3,
        29.80944537853352`}, {4, 51.91498227160025`}, {5, 80.15728480946696`}, {6,
         114.53635299213369`}, {7, 155.0521868196004`}, {8,
        201.70478629186715`}, {9, 254.49415140893387`}, {10,
        313.4202821708005`}, {11, 378.48317857746724`}, {12,
        449.682840628934`}, {13, 527.0192683252008`}, {14,
        610.4924616662674`}, {15, 700.1024206521342`}, {16, 795.849145282801`}};
you can derive the optimal 2nd order function
nlm = NonlinearModelFit[data, c + b t + a t^2, {a, b, c}, t];
ffit = nlm["BestFit"]
which gives ffit close to yout result:
0.313429 + 0.626857 t + 3.06838 t^2
Next you do a series expansion up to 1st order for every data point resultin in a list of linear functions:
lst = Map[Simplify[Normal[Series[ffit, {t, #, 1}]]] &, data[[All, 1]]]
{-2.75495 + 6.76362 t, -11.9601 + 12.9004 t, -27.302 +
  19.0372 t, -48.7807 + 25.1739 t, -76.3961 + 31.3107 t, -110.148 +
  37.4475 t, -150.037 + 43.5842 t, -196.063 + 49.721 t, -248.226 +
  55.8577 t, -306.525 + 61.9945 t, -370.961 + 68.1313 t, -441.534 +
  74.268 t, -518.243 + 80.4048 t, -601.09 + 86.5416 t, -690.073 +
  92.6783 t, -785.193 + 98.8151 t}
In order to visualize the results you can create a table of plots
plt = Table[
   ListPlot[
    Table[{t, lst[[n]]}, {t, n, n + 1}],
     PlotRange -> {{0, 16}, {0, 900}}, Joined -> True,
    PlotStyle -> {{{Thin, Red}, {Thin, Green}}[[Mod[n, 2] + 1]]}],
   {n, 1, 16}];
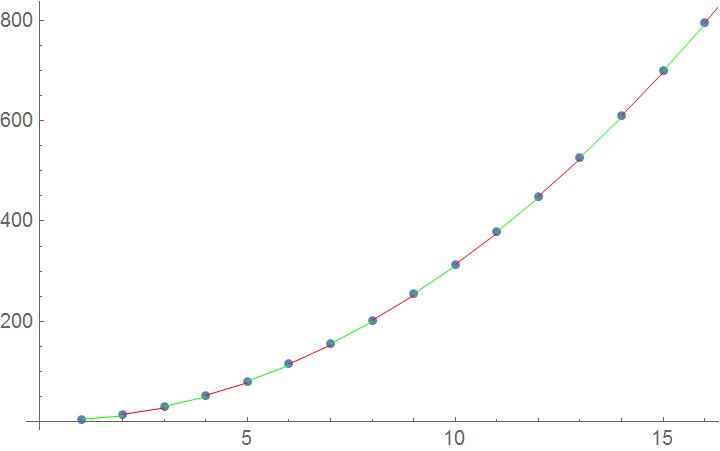
which look like

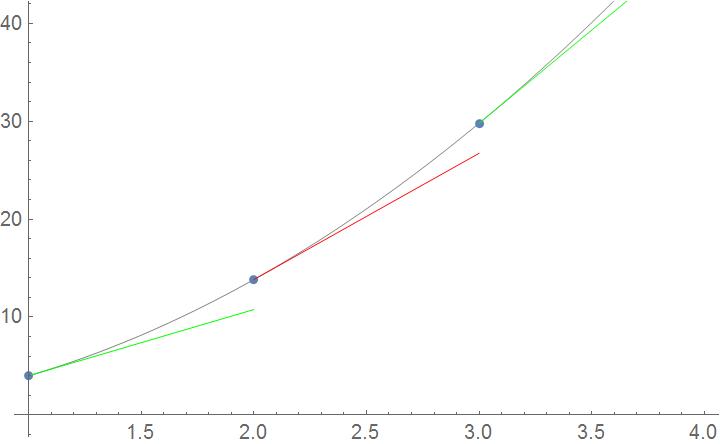
The linear functions match quite closely, to see the differences you need to zoom in: