Message Boards Message Boards

0
|
8481 Views
|
5 Replies
|
4 Total Likes
View groups...
Share
Share this post:

[?] Use MeshStyle colors and PointSize properly?

Posted 7 years ago

Dear All,

Please can you help. I got a simple question.

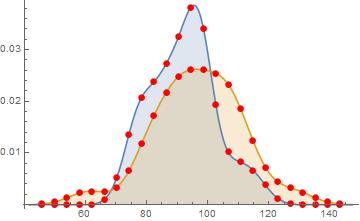
Does any one know why the MeshStyle colors Red vs. Blue and PointSize [0.03] vs. [0.02] are not properly working?

fakedata1 = {97, 98, 88, 107, 96, 84, 87, 77, 85, 78, 98, 98, 95, 92, 
   111, 97, 78, 92, 98, 87, 98, 80, 116, 75, 91};

fakedata2 = {92, 95, 93, 84, 104, 88, 106, 91, 104, 92, 102, 111, 61, 
   128, 110, 116, 100, 107, 81, 95, 87, 109, 81, 79, 99};

SmoothHistogram[
 {Tooltip[fakedata1], Tooltip[fakedata2]}
 , Filling -> Axis
 , PlotLegends -> {"fakedata1", "fakedata2"}
 , Mesh -> 25
 , MeshStyle -> {Directive[PointSize[0.03], Blue, PointSize[0.02], 
    Red]}
 ]

Thanks,....Jos

enter image description here

POSTED BY: Jos Klaps
5 Replies

It looks like a bug in SmoothHistogram:

SmoothHistogram[{Range[10], Range[20]}, Mesh -> {2, 5}, 
  MeshStyle -> {Red, Blue}][[1, 2, 2, 2]]

The mesh points for the two different datasets are lumped into a single Point primitive and not kept distinct. The MeshStyle directives are simply prepended, so that the last prevail. I cannot see a way of giving different Mesh values to the two datasets: with Mesh -> {2, 5} the value 2 is used for both curves.

POSTED BY: Gianluca Gorni

Hi Jos, I think it doesn't work like that. The Meshstyle is linked to the meshfunctions and seems that the documentation also points out that the style is for all lines drawn. example to clarify my thoughts:

SmoothHistogram[{Tooltip[fakedata1], Tooltip[fakedata2]}, 
 Filling -> Axis, PlotLegends -> {"fakedata1", "fakedata2"}, 
 MeshFunctions -> {#1 &, #2 &}, Mesh -> {5, 2}, 
 MeshStyle -> {{PointSize[0.03], Blue}, {PointSize[0.02], Red}}]

enter image description here

POSTED BY: l van Veen

That's right! It is not a bug. To get different mesh styles in the two curves you may have to draw them separately:

pl = Show[
   SmoothHistogram[{Tooltip[fakedata1]}, Filling -> Axis, Mesh -> 25, 
    MeshStyle -> Directive[PointSize[0.03], Blue], PlotStyle -> Blue],
    SmoothHistogram[Tooltip[fakedata2], Filling -> Axis, Mesh -> 25, 
    MeshStyle -> Directive[PointSize[0.02], Red], 
    PlotStyle -> Brown]];

The legends may require some contortion, too:

lgnds = SmoothHistogram[{Tooltip[fakedata1], Tooltip[fakedata2]}, 
    PlotLegends -> {"fakedata1", "fakedata2"}, 
    PlotStyle -> {Blue, Brown}][[2]];
Legended[pl, lgnds]
POSTED BY: Gianluca Gorni

(1) You're mixing up MeshStyle and PlotStyle. You want to use PlotStyle.

(2) These functions take a list of different styles if you want them to have different style for each function:

SmoothHistogram[{Tooltip[fakedata1], Tooltip[fakedata2]}, 
 Filling -> Axis, PlotLegends -> {"fakedata1", "fakedata2"}, 
 Mesh -> 25, 
 PlotStyle -> {Directive[PointSize[0.03], Blue], 
   Directive[PointSize[0.02], Red]}]
POSTED BY: Sean Clarke

Dear All,

@Gianluca Gorni, @l van Veen and @Sean Clarke. Thanks for your quick reply and excellent support.

@Gianluca Gorni.The option to draw two curves separately are working very well. Many thanks.enter image description here

@Sean Clarke: the option with PlotStyle instead of MeshStyle is it still not working, the two curves are still in one (Blue) color only. See plot below.

SmoothHistogram[{Tooltip[fakedata1], Tooltip[fakedata2]}, 
 Filling -> Axis, PlotLegends -> {"fakedata1", "fakedata2"}, 
 Mesh -> 25, 
 PlotStyle -> {Directive[PointSize[0.03], Blue], 
   Directive[PointSize[0.02], Red]}]

enter image description here

Thanks again,....Jos

POSTED BY: Jos Klaps
Reply to this discussion
Community posts can be styled and formatted using the Markdown syntax.
Reply Preview
Attachments
Remove
or Discard

Group Abstract Group Abstract