"For Christmas, Mrs. Potipher Perkins received a very pretty patchwork quilt constructed of 169 square pieces of silk material. The puzzle is to find the smallest number of square portions of which the quilt could be composed and show how they might be joined together. Or, to put it the reverse way, divide the quilt into as few square portions as possible by merely cutting the stitches." Henry E. Dudeney
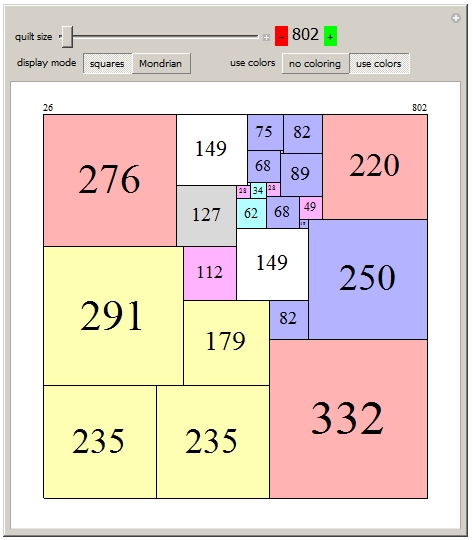
I recently updated the Wolfram Demonstration Mrs. Perkins's Quilts with solutions to 40000. Dudeney's puzzle asks for the fewest integer-sided squares that a 13×13 square can be divided into. The same question could be asked for squares of size 17, 19, 29, and 31. Here are the optimal answers, with orders (count of squares) 11, 12, 13, 14, and 15.

How about squares 16, 32, 64, 128, and 256? One method might be to divide each of these into 4 squares. The Demonstration Minimally Squared Rectangles is similar to that. For the Quilts problem there is one other requirement: the greatest common denominator of the sizes has to be 1. In each quilt it's easy to find two sizes that are relatively prime.

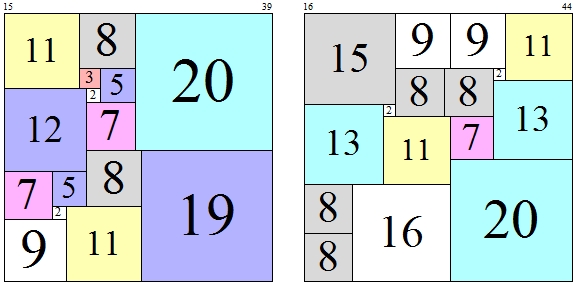
The program uses a number of what I call primitive quilts, which cannot be grown from smaller quilts. Here are two of the primitive quilts, numbers 15 and 16 in my list, which happen to have orders 15 and 16.
Row[ShowQuilt[primitivequilts[[#]], True, 300] & /@ {15, 16}]

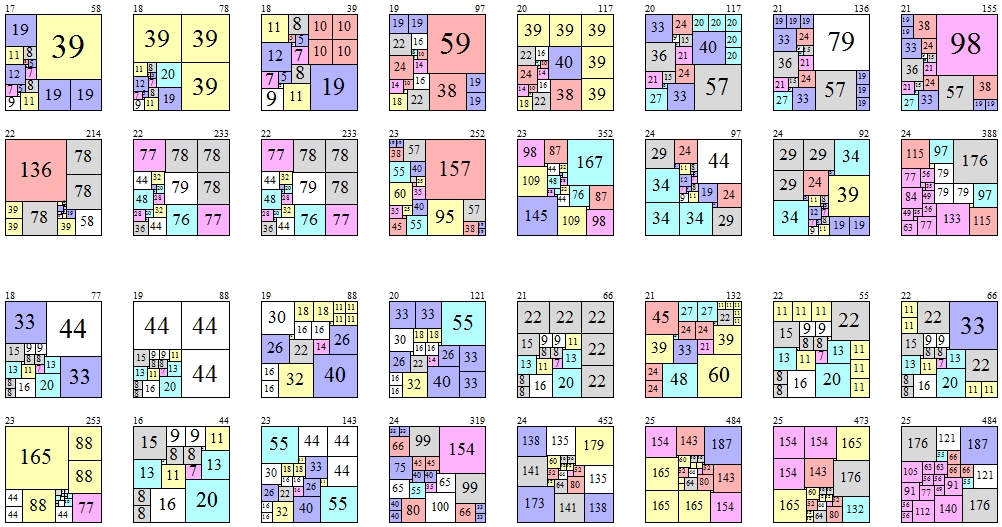
Here are what the 16 growth methods look like when aimed at the top right corner. Growth methods don't always grow a quilt in different ways.
Column[Riffle[Grid[Partition[Table[ShowQuilt[GrowSquares[primitivequilts[[#]], {jj, 1}], True, 120], {jj, 1, 16}], 8]] & /@ {15, 16}, Spacer[{30, 30}]]]

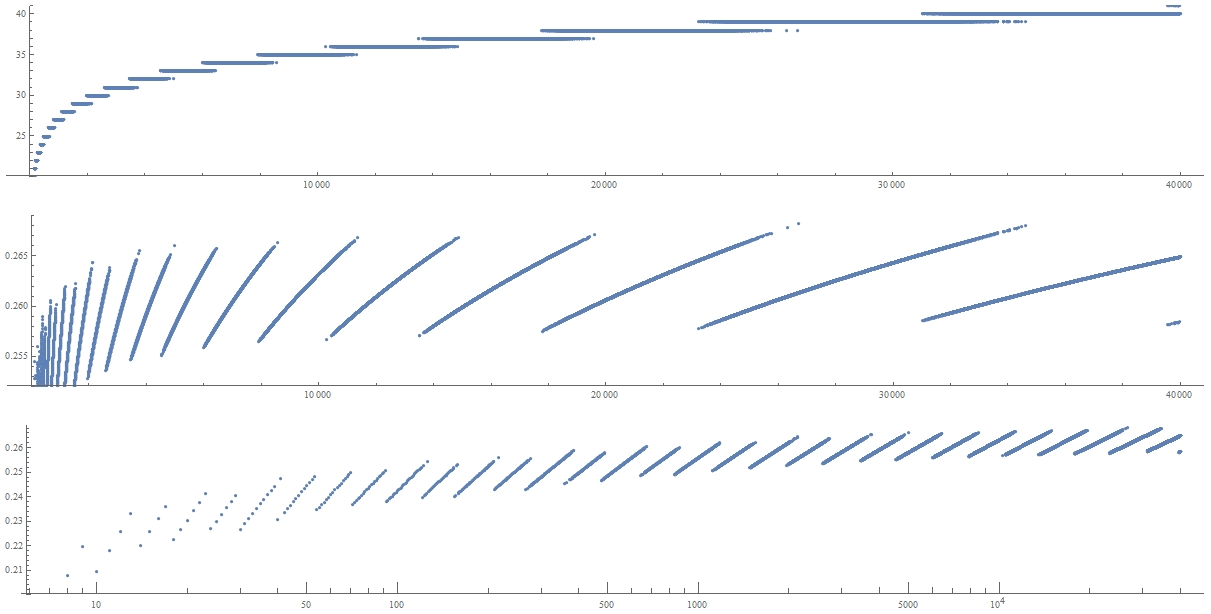
The order starts as 1, 4, 6, 7, 8, 9, 9, 10, 10, 11, 11, 11, 11, 12, 12, 12, 12, 13, 13, 13, 13, 13, 13, 14, 14, 14, 14, 14, 14, ... (A005670). Here are some plots of the order for quilts up to size 40000. The first is an ordinary list plot. For the second, we divide the log of the size by the order, and usually get a value near 0.26 for large optimal quilts. The third is a ListLinearLogPlot of these same values.
ListPlot[#[[1]] & /@ Take[optimalgrowth, {8, 40000}], PlotRange -> {20, 41}, AspectRatio -> 1/7, ImageSize -> {1200, 200}]
ListPlot[N[Log[#[[2]]]/#[[1]]] & /@ Take[optimalgrowth, {8, 40000}], PlotRange -> {.252, .269}, AspectRatio -> 1/7, ImageSize -> {1200, 200}]
ListLogLinearPlot[{#[[2]], N[Log[#[[2]]]/#[[1]]]} & /@ Take[optimalgrowth, {8, 40000}], PlotRange -> {.2, .269}, AspectRatio -> 1/7, ImageSize -> {1200, 200}]

Anyways, go feel free to play with the data at Mrs. Perkins's Quilts.
