This project takes in an image of a regular tiling, analyzes it, and returns information about the tiling. It analyzes the image using image processing and returns one individual component of the tiling, the number of individual components in the tiling, the angles that the components create with respect to the x-axis, lines going through the pattern of repeating components, the path of the centroids of the components going from the lowest to the highest on the x-axis, the path of the centroids of the components going from the lowest to the highest on the y-axis, a Delaunay mesh from the centroids of the components, and a Voronoi mesh from the centroids of the components.
First I created a function called binarize which takes in an image, binarizes it making the bigger portion of color white.
binarize[img_] :=
  First@MaximalBy[{
     Binarize[Erosion[img, 1]],
     Binarize[Erosion[ColorNegate@img, 1]]
     },
    ImageMeasurements[#, "Mean"] &
    ];
My first function selects one full component from the tiling. It does this by first selecting all the large components to remove the smaller components and then removing the components that touch the sides because they are likely to be only partial components. Then it selects one of the components and crops the image to that individual component.
TilingInformation[img_, "Tile"] :=
  If[Length[
     ComponentMeasurements[
      SelectComponents[binarize[img], #AdjacentBorderCount == 0 &],
      "Count"]] > 1,
   ImagePad[
    ImageCrop[
     SelectComponents[
      SelectComponents[
       SelectComponents[binarize[img], #AdjacentBorderCount == 0 &],
       Large], "Count", 1]], 10],
   ImagePad[
    ImageCrop[
     SelectComponents[SelectComponents[binarize[img], Large], "Count",
       1]], 10]];

The next function counts how many full components are in the image of the tiling by selecting the same components that were not touching the border and the large components before counting how many there are.
TilingInformation[img_, "TileCount"] :=
  If[Length[
     ComponentMeasurements[
      SelectComponents[binarize[img], #AdjacentBorderCount == 0 &],
      "Count"]] > 1,
   Length[ComponentMeasurements[
     SelectComponents[binarize[img], #AdjacentBorderCount == 0 &],
     "Count"]],
   Length[ComponentMeasurements[binarize[img], "Count"]]];
Then the third function is able to label each full component by selecting the full components that were not touching the border and then mapping text onto the centroids of these components.
TilingInformation[img_, "TileLabel"] :=

  With[{components =
     SelectComponents[
      Erosion[Binarize[img, FindThreshold@img],
       0.49], #AdjacentBorderCount == 0 &]},
   Show[img,
    Graphics[{Red,
      Style[Text @@@
        Partition[
         Riffle[Range[TilingInformation[components, "TileCount"]],
          Sort[Map[Last,
            ComponentMeasurements[components, "Centroid"]], #[[
             2]] &]], 2], 15]}]]];
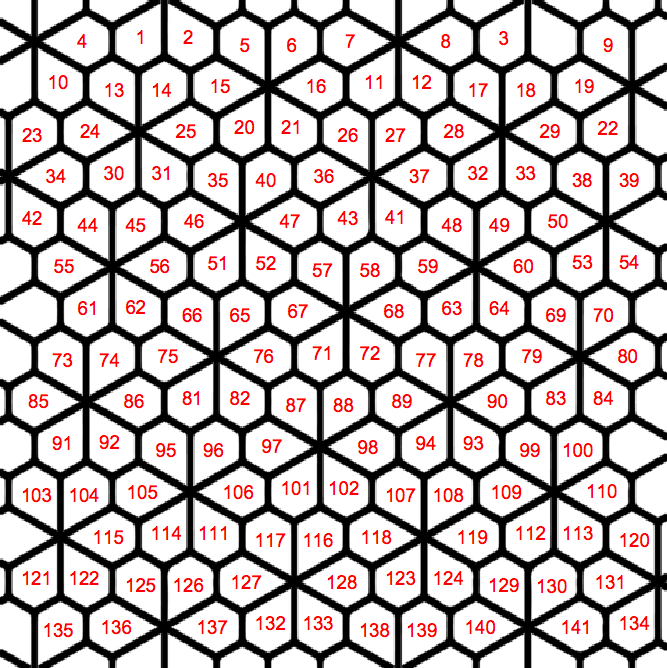
The fourth function outputs a line going through the repating components in the tiling by first taking the nearest congruent components and then using InfiniteLine to go through the centroid of the component nearest to the center of the image and the centroid of the nearest congruent component to the center component.
    TilingInformation[img_, "TilePatternLines"] :=
        Module[{imgx, c, tile, sameTiles, m, centroids, nf, centerCentroid,
        nearest, d, takeCount, centerComponent, connected, adjacent},
        imgx = img;
        c = SelectComponents[
        Erosion[Binarize[imgx, FindThreshold@imgx],
        1], #AdjacentBorderCount == 0 &];
        tile = If[
        Length[ComponentMeasurements[
        SelectComponents[
        Erosion[Binarize[c], 1], #AdjacentBorderCount == 0 &],
        "Count"]] > 1,
        ImagePad[
        ImageCrop[
        SelectComponents[
        SelectComponents[
        SelectComponents[
        Erosion[Binarize[c], 1], #AdjacentBorderCount == 0 &],
        Large], "Count", 1]], 10],
        ImagePad[
        ImageCrop[
        SelectComponents[
        SelectComponents[Erosion[Binarize[c], 1], Large], "Count", 1]],
        10]];
        sameTiles = ImageAdjust@Opening[c, ImageData[tile]];
        m = MorphologicalComponents[sameTiles];
        centroids = ComponentMeasurements[{m, sameTiles}, "Centroid"];
        nf = Nearest[centroids[[All, 2]]];
        centerCentroid = First@nf[ImageDimensions[sameTiles]/2.0];
        nearest =
        SortBy[centroids, EuclideanDistance[#[[2]], centerCentroid] &];
        d = EuclideanDistance[#[[2]], centerCentroid] & /@ nearest;
        takeCount =
        1 + LengthWhile[
        PeakDetect[Differences[Rest@d], Automatic, Automatic,
        1], # === 0 &];
        centerComponent = selectOne[m, nearest[[1, 1]]];
        connected = Take[nearest, UpTo[takeCount + 1]];
        adjacent = Rest@connected[[All, 2]];
        Show[ImageMultiply[imgx,
        ImageAdd[ImageMultiply[sameTiles, 0.5], 0.5]],
        Graphics[{Red, Thickness[0.01],
        Table[InfiniteLine[{adjacent[[n]], centerCentroid}], {n, 1,
        Length[adjacent]}]}]]
        ]
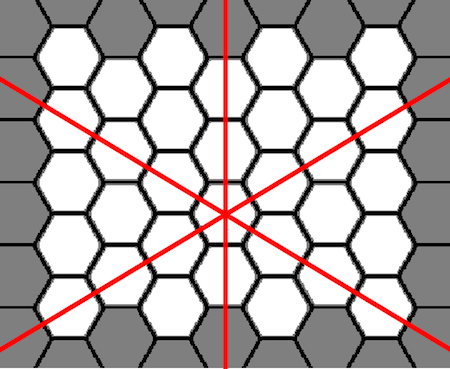
The fifth function outputs the angle between a line going through the repeating components (as shown in the previous function) and the x-axis by using the VectorAngle function.
selectOne[m_, index_] := Binarize[Image[m], {index, index}];
connectedQ[m_, centerComponent_][index_] :=

  Length[ComponentMeasurements[
     Dilation[ImageAdd[centerComponent, selectOne[m, index]], 3],
     "Count"]] === 1;

TilingInformation[img_, "TilePatternAngle"] :=

  Module[{c, tile, sameTiles, m, centroids, nf, centerCentroid,
    nearest, d, takeCount, centerComponent, connected, adjacent,
    firstVec, firstAngle},
   c = SelectComponents[
     Erosion[Binarize[img, FindThreshold@img],
      1], #AdjacentBorderCount == 0 &];
   tile =
    If[Length[
       ComponentMeasurements[
        SelectComponents[
         Erosion[Binarize[c], 1], #AdjacentBorderCount == 0 &],
        "Count"]] > 1,
     ImagePad[
      ImageCrop[
       SelectComponents[
        SelectComponents[
         SelectComponents[
          Erosion[Binarize[c], 1], #AdjacentBorderCount == 0 &],
         Large], "Count", 1]], 10],
     ImagePad[
      ImageCrop[
       SelectComponents[
        SelectComponents[Erosion[Binarize[c], 1], Large], "Count",
        1]], 10]];
   sameTiles = ImageAdjust@Opening[c, ImageData[tile]];
   m = MorphologicalComponents[sameTiles];
   centroids = ComponentMeasurements[{m, sameTiles}, "Centroid"];
   nf = Nearest[centroids[[All, 2]]];
   centerCentroid = First@nf[ImageDimensions[sameTiles]/2.0];
   nearest =
    SortBy[centroids, EuclideanDistance[#[[2]], centerCentroid] &];
   d = EuclideanDistance[#[[2]], centerCentroid] & /@ nearest;
   takeCount =
    1 + LengthWhile[
      PeakDetect[Differences[Rest@d], Automatic, Automatic,
       1], # === 0 &];
   centerComponent = selectOne[m, nearest[[1, 1]]];
   connected = Take[nearest, UpTo[takeCount + 1]];
   adjacent = Rest@connected[[All, 2]];
   firstVec = adjacent[[1]] - centerCentroid;
   firstAngle = VectorAngle[firstVec, {1, 0}];
   Sort[Mean /@
     FindClusters[
      Table[Mod[
        180*(VectorAngle[adjacent[[n]] - centerCentroid, firstVec] +
            firstAngle)/Pi, 180], {n, 1, Length[adjacent]}]]]
   ];
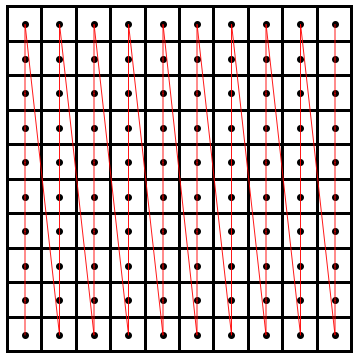
Then the next two functions connect the centroids of the individual components of the tiling from the lowest on the x axis and y axis. This was done by sorting the centroids by their x and y values of the coordinates and connecting them with a line.
TilingInformation[img_, "TilePathX"] :=
  Show[img,
   With[{components =
      SelectComponents[
       Erosion[Binarize[img, FindThreshold@img],
        0.5], #AdjacentBorderCount == 0 &]},
    Graphics[{PointSize[Large],
      Point @@@
       List /@ Map[Last,
         ComponentMeasurements[components, "Centroid"]],
      Thickness[0.0025], Red,
      Line @@@
       List /@ Partition[
         Sort[Sort[
           Map[Last,
            ComponentMeasurements[components, "Centroid"]], #[[
             2]] &]], 2, 1]}]]];

TilingInformation[img_, "TilePathY"] :=
 Show[img,
  With[{components =
     SelectComponents[
      Erosion[Binarize[img, FindThreshold@img],
       0.5], #AdjacentBorderCount == 0 &]},
   Graphics[{PointSize[Large],
     Point @@@
      List /@ Map[Last,
        ComponentMeasurements[components, "Centroid"]],
     Thickness[0.0025], Red,
     Line @@@
      List /@ Partition[
        Sort[Map[Last,
          ComponentMeasurements[components, "Centroid"]], #[[2]] &],
        2, 1]}]]]
The two final functions create a Voronoi and Delaunay Mesh on top of the tiling. This function was done by using the functions VoronoiMesh and DelaunayMesh on the list of centroids of the full individual components. Then I only showed the lines when superimposed on top of the original image.
TilingInformation[img_, "DelaunayPatternMesh"] :=
 Show[img,
  DelaunayMesh[
   Map[Last,
    ComponentMeasurements[
     SelectComponents[binarize[img], #AdjacentBorderCount == 0 &],
     "Centroid"]], PlotTheme -> "Lines",
   MeshCellStyle -> {{1, All} -> {Thick, Red}, {0,
       All} -> {PointSize[Large], Black}}]]

TilingInformation[img_, "VoronoiPatternMesh"] :=
 Show[img,
  VoronoiMesh[
   Map[Last,
    ComponentMeasurements[
     SelectComponents[binarize[img], #AdjacentBorderCount == 0 &],
     "Centroid"]], PlotTheme -> "Lines",
   MeshCellStyle -> {{1, All} -> {Thick, Red}, {0,
       All} -> {PointSize[Large], Black}}]]
VoronoiMesh: 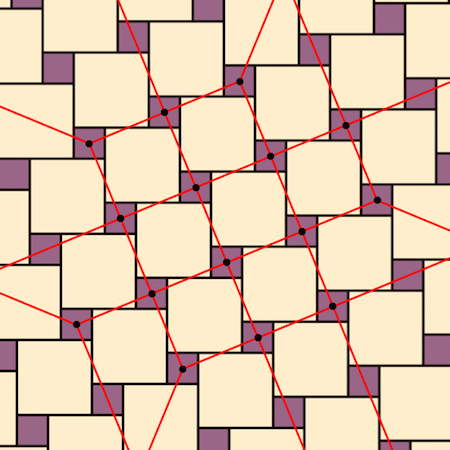
DelaunayMesh: 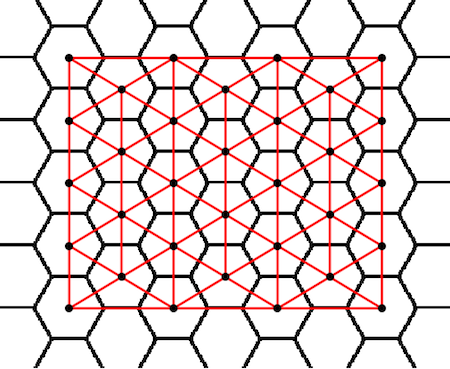
You can try analyzing tiles at my microsite with the link here: https://www.wolframcloud.com/objects/user-6273eddc-d3df-4e86-b0c1-e2f2774f96d1/AnalyzingRegularTilings