Message Boards Message Boards

[?] CountourPlot of (Cos(2x))^2 ==0 ?

Posted 7 years ago

Hello,

I am trying to plot the countour curve of (cos(2x))^2 ==0 on the xy-plane for {x, -pi/2, pi/2} and {y,0,2pi}, but the results is an empty plot in mathemaitca. However, I obtained the correct plot for cos(2x)==0.

I used the following command lines:

ContourPlot[Cos[2x]^2 ==0, {x, -Pi/2, Pi/2}, {y, 0, 2Pi}]

How can I get the correct graph for this?

Thank you,

Bhagya

POSTED BY: Bhagya Athu
7 Replies

It's interesting that the graph may be obtain if the right part is not exactly $0$:

ContourPlot[
 Cos[2 x]^2 == 0.000000000000000001, {x, -\[Pi]/2, \[Pi]/2}, {y, 0, 
  2 \[Pi]}]

enter image description here

The numerical algorithms of ContourPlot assume nonzero derivative, or transversality, otherwise they may fail spectacularly:

ContourPlot[x^2 == 0, {x, -1, 1}, {y, 0, 1}]

In your case you get a correct plot by symbolic pre-processing:

ContourPlot[
 Evaluate[List @@ 
   Reduce[Cos[2*x]^2 == 0 && -Pi/2 < x < Pi/2, x, Reals]],
 {x, -Pi/2, Pi/2}, {y, 0, 2 Pi}]
POSTED BY: Gianluca Gorni

Apropos, dear Gianluca,

How to interpret the following?

ContourPlot[x^2 == .0001, {x, -1, 1}, {y, -1, 1}]

enter image description here

ContourPlot[x^2 == .0001, {x, -1, 1}, {y, -1, 1}, PlotRange -> All]

enter image description here

Apropos, dear Gianluca,

How to interpret the following?

ContourPlot[x^2 == .0001, {x, -1, 1}, {y, -1, 1}]

enter image description here

ContourPlot[x^2 == .0001, {x, -1, 1}, {y, -1, 1}, PlotRange -> All]

enter image description here

POSTED BY: Gianluca Gorni

There are curious discretization artifacts:

ContourPlot[x^2 == 1/10000, {x, -1, 1}, {y, -1, 1}, 
 PlotRange -> {{.0022, .01}, {-.3, .3}}]
ContourPlot[10000 x^2 == 1, {x, -1, 1}, {y, -1, 1}, 
 PlotRange -> {{.0022, .01}, {-.3, .3}}]

Also, in the current Mathematica version the tooltip looks like a job left incomplete.

POSTED BY: Gianluca Gorni

Really curious... You are right!

And one more additional curiosity:

ContourPlot[x^2 == 1/10000, {x, -1, 1}, {y, -1, 1}, PlotRange -> {{.0022, .01}, {-.3, .3}}, PlotPoints -> 30]
ContourPlot[10000 x^2 == 1, {x, -1, 1}, {y, -1, 1}, PlotRange -> {{.0022, .01}, {-.3, .3}}, PlotPoints -> 30]
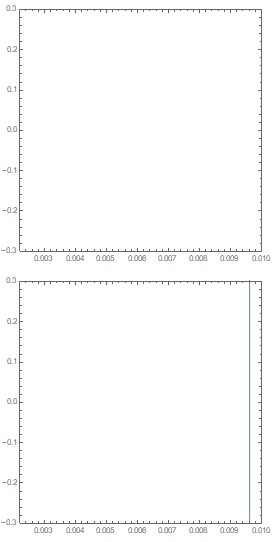
enter image description here

Why are not identical the results?

Reply to this discussion
Community posts can be styled and formatted using the Markdown syntax.
Reply Preview
Attachments
Remove
or Discard

Group Abstract Group Abstract