Message Boards Message Boards

[?] Use your own functions in a parametric plot?

Posted 7 years ago

Consider the following code:

x[t_] := (a - b) Cos[t] + b Cos[(a/b - 1) t]
y[t_] := (a - b) Sin[t] - b Sin[(a/b - 1) t

for example ParametricPlot[{x[t], y[t] }, {t, 0, 12 [Pi]}, .....] I tried different ways without success.

POSTED BY: Lisan Lisov
5 Replies

what are the values of a and b? Also, you don't have a semicolon between the definitions of the two functions or a closing ] at the end and you have [ ] around Pi.

a = 2; b = 3;

x[t_] := (a - b) Cos[t] + b Cos[(a/b - 1) t]; 
y[t_] := (a - b) Sin[t] - b Sin[(a/b - 1) t];

ParametricPlot[{x[t], y[t]}, {t, 0, 2 Pi}]

enter image description here

POSTED BY: Frank Kampas

Try this:

x[t_, a_, b_] := (a - b) Cos[t] + b Cos[(a/b - 1) t]
y[t_, a_, b_] := (a - b) Sin[t] - b Sin[(a/b - 1) t]

Manipulate[
 ParametricPlot[{x[t, a, b], y[t, a, b]}, {t, 0, 12 Pi}], {a, 1/2, 
  59/6, 1/3}, {b, 1, 10}]

enter image description here

Posted 7 years ago

Thank youThank you!

POSTED BY: Lisan Lisov

One more variation on the same subject:

z[t_, a_, b_] := {(a - b) Cos[t] + b Cos[(1 - a/b) t], (a - b) Sin[t] + b Sin[(1 - a/b) t]}

ParametricPlot[
 Evaluate[MapThread[
   z[t, #1, #2] &, {Range[-(1/2), 9, 1/3], 
    Range[-(1/3), 14, 1/2]}]], {t, 0, 180 \[Pi]}, 
 PlotTheme -> "Marketing", Axes -> False, 
 PlotStyle -> Thick]
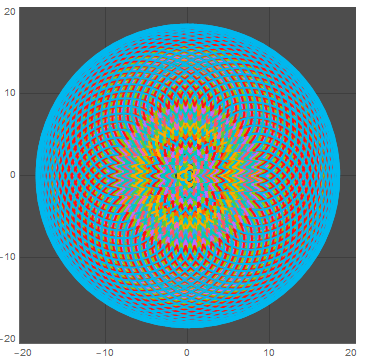
enter image description here

Posted 7 years ago

Very nice! Thank you!

POSTED BY: Lisan Lisov
Reply to this discussion
Community posts can be styled and formatted using the Markdown syntax.
Reply Preview
Attachments
Remove
or Discard

Group Abstract Group Abstract