Hi,
I would strongly discourage creating a list from the solution of the ODE. Mathematica gives you in this case the analytical solution that you can plot directly.
H = DSolve[{u''''[x] + u''[x] + u[x] == 0, u[0] == 1, u'[0] == 2, u[1] == 3, u'''[1] == 5}, u[x], x];
Note that you shouldn't use variable or function names starting with a capital - it is customary to avoid capitalisation for user defined functions. I use your capital H here to stay as close as possible to your question.
Here is how you plot the solution:
Plot[u[x] /. H[[1]], {x, 0, 10}]
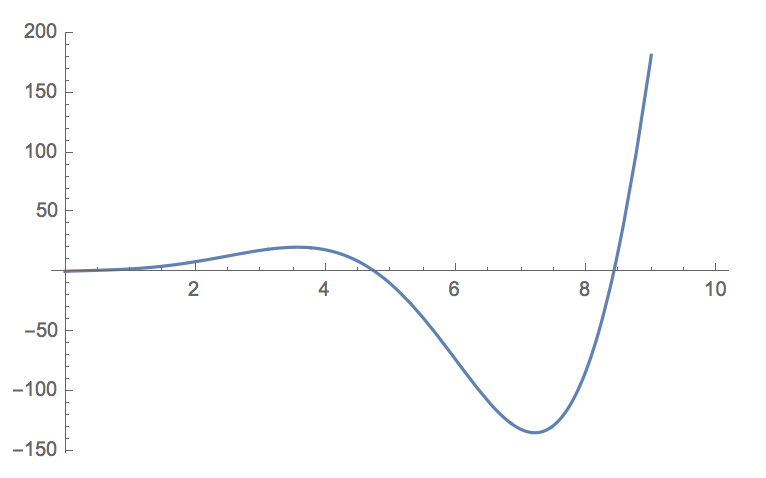
Mathematica takes care of plotting it. You can also calculate derivatives and many other things. Now if you insist on using ListPlot (emulating perhaps other programming languages) you can do this like so:
ListPlot[Table[{x, u[x] /. H[[1]]}, {x, 0, 10, 0.1}]]
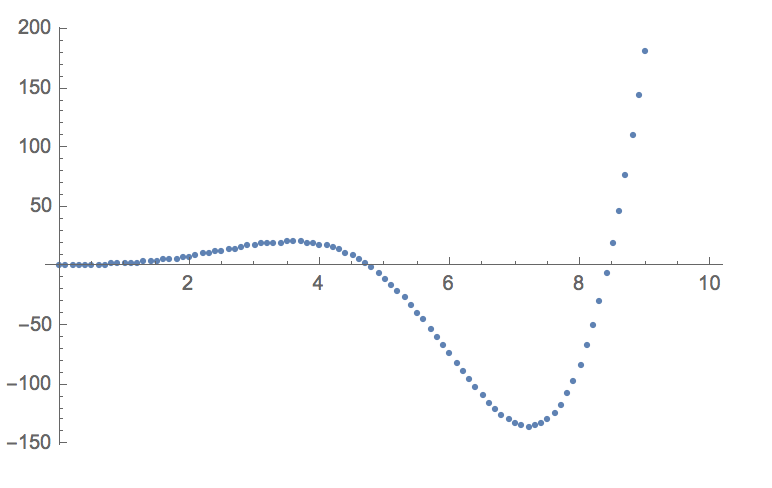
But it is weird to evaluate a perfectly good function at some discrete points and then plot the table, in particular if you have a tool as powerful as Mathematica.
Best wishes,
Marco


