I am currently trying to make a contour plot of a transmission function. It is a very naughty function as some parts will tend to infinity and others to zero, however as a whole it will (in the allowed cases at least) stay between 0 and 1, as it should. This function depends on five parameters and these parameters are used to define expressions to simplify the function because it is huge. Just as an example, this is what my code would look like:
V = 5; U = 4; h = 1.6; v = 0.6; (*assigning a numerical value to the parameters*)
K = U + V +hv(a + b) (*defining an expression where 'a' and 'b' are variables.*)
T[a_, b_] = K + hv (*defining a function*)
ContourPlot[T[a,b], {a, 0.0,  1.0},  {b, 0.0,  1.0}]
Now the problem comes when I change the order in which I assign values to my parameters. If I do it at the beginning of my program I'll have one ContourPlot (1), however if I assign values to my parameters just before I order the plot; for example:
K = U + V +hv(a + b)
T[a_, b_] = K + hv
V = 5; U = 4; h = 1.6; v = 0.6;
ContourPlot[T[a,b], {a, 0.0,  1.0},  {b, 0.0,  1.0}]
I'll get something very different (2).So I tried simplifying this last expression before the plot and after assigning the values:
K = U + V +hv(a + b)
T[a_] = K + hv
V = 5; U = 4; h = 1.6; v = 0.6;
T[a_, b_] = Simplify[ T[a_, b_] ]
ContourPlot[T[a,b], {a, 0.0,  1.0},  {b, 0.0,  1.0}]
and the result was again (1).
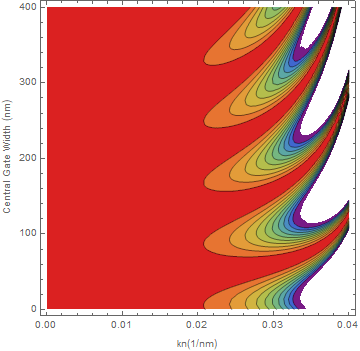 (1)
(1) 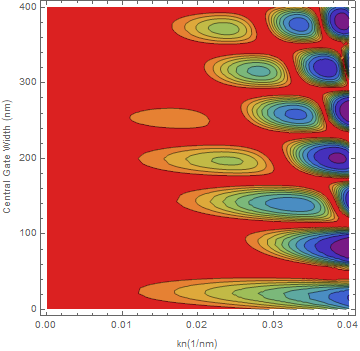 (2)
(2)
I read the Evaluation procedure, and it seems logical that Mathematica was simplifying the expressions as much as it could with the parameters given. When the parameters were not given numerical values, Mathematica did not simplify and ended up with a more complex function and given its naughtiness, I assume some information may change in the process.
The question is, what is the correct plot/process? How can identify the correct procedure in these cases? Thank you in advance.
Edit: I posted two notebooks where this same thing happens.
 Attachments:


