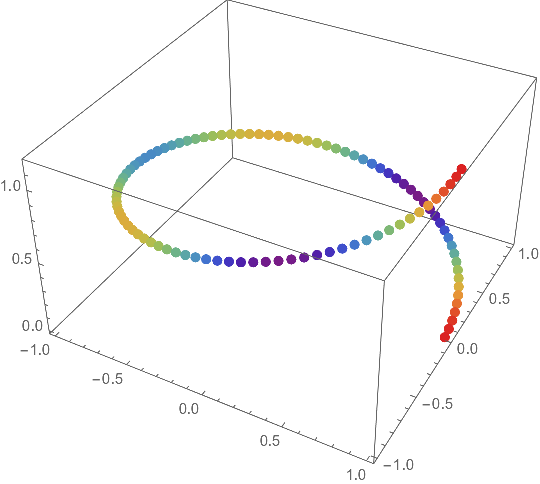
There is a built-in function for doing what you want, Rescale:
colorfunc = ColorData["Rainbow"];
Graphics3D[{PointSize[0.02],
  Point[coord, VertexColors -> colorfunc /@ Rescale[vels]]},
 Axes -> True]

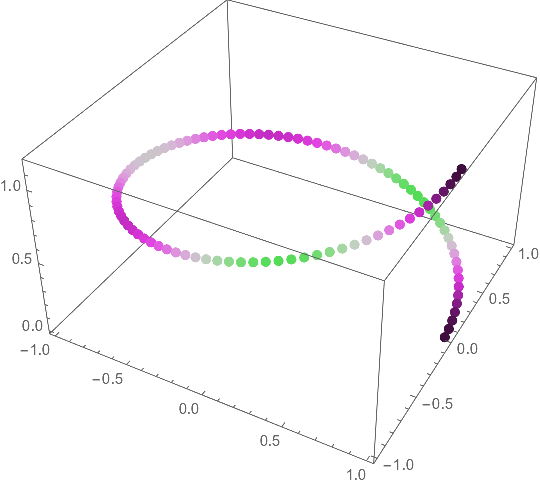
Since you mention the zero velocity, you might want to control what color represents zero. The Interpolation below runs uniformly between ± the maximum speed, so that the zero velocity coincides with the color at 0.5. It can be used to rescale the velocity.
resc = Interpolation[{{-Max@Abs[vels], 0.}, {Max@Abs[vels], 1.}}, InterpolationOrder -> 1]; (* assume velocities of different signs *)
colorfunc = Blend[{ColorData["TemperatureMap"][#], Black}, (1.2 # (1 - #))^2] &;
Graphics3D[
 {PointSize[0.02], Point[coord, VertexColors -> colorfunc /@ resc[vels]]},
 Axes -> True]

One can give more waypoints to the interpolation so that the zero velocity is assigned specifically to a value. The scaling above and below zero can vary. For example,
resc2 = Interpolation[{{Min[vels], 0.}, {0., 0.5}, {Max[vels], 1.}}, InterpolationOrder -> 1];
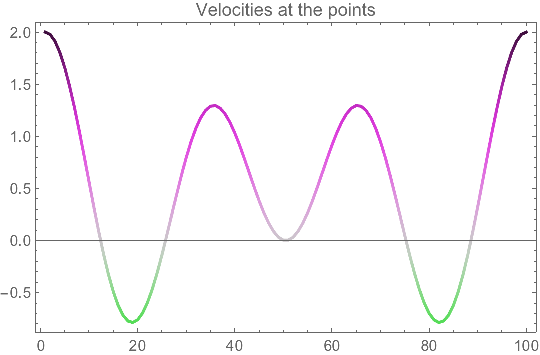
One can plot the velocities, too:
Graphics[{
  Thick,
  Line[MapIndexed[Flatten@{#2, #1} &, vels],
   VertexColors -> colorfunc /@ resc[vels]]
  }, AspectRatio -> 0.618, Axes -> True, Frame -> True,
 PlotLabel -> "Velocities at the points"]
