There are a number of sub-problems that you will want to solve and put together to build a solution.
1. Import your data from XLS:
http://reference.wolfram.com/mathematica/howto/ImportASpreadsheet.htmlhttp://reference.wolfram.com/mathematica/ref/format/XLS.html2. Manipulate your data into the correct form so that it can be used by Mathematica's functions. Mathematica stores data using nested lists:
http://reference.wolfram.com/mathematica/howto/WorkWithNestedLists.html3. Write a program that can use a time-slice of the heat data and create a 3D represtation of it. My suggestion would be to use RegionPlot3D and to use the ColorFunction option:
http://reference.wolfram.com/mathematica/ref/RegionPlot3D.htmlFor example, let's say our room is a 1 x 1 x 1 unit box and has temperatures given by the set of data generated by the code below:
tempdata = Flatten[Table[{{x, y, z}, x - y + Sin[2 Pi z]}, {x, 0, 1, 0.1}, {y, 0, 1, 0.1}, {z, 0, 1, 0.1}], 2]
"tempdata" is a list of pairs. The first value of each pair is a 3D x,y,z coordinate and the last value of each pair is the temperature of the box at that point. Since we need to have an estimate of the temperature at any point in the 1x1x1 unit box, make an interpolation of the data:
tempFunction = Interpolation[tempdata]
Here is how we can make a unit box using RegionPlot3D:
RegionPlot3D[True, {x, 0, 1}, {y, 0, 1}, {z, 0, 1}]
Now we must define a ColorFunction in some way. This will depend on what colors you might want for example in your output:
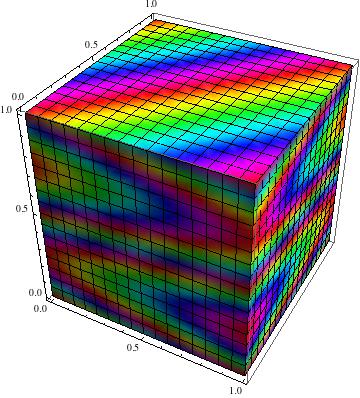
RegionPlot3D[True, {x, 0, 1}, {y, 0, 1}, {z, 0, 1},
ColorFunction -> Function[{x, y, z}, Hue[tempFunction[x, y, z]]]]

You will probably want to change the way the colors are defined on the box, please see the examples of ColorFunction in the documentation for examples of how it is used. You may also want to use options such as ColorFunctionScaling->False.
4. You mentioned that you have a time series of this data. In this case are you looking to make an animation of the heat in the room over time? After writing a program that produces a visualization of the room at a specific time step, you can combine a list of the vizualizations together with ListAnimate or other similar functions in Mathematica. You can for example, bring them together into a gif.
Each of these steps are not trivial for someone learning Mathematica. I would reccomend
reading through Mathematica's virtual book first to get a good overview of how to program with Mathematica and then work on each of these steps individually.