To plot the point A[100] it needs to calculate the values for A[99] and G[99]. To calculate the values for A[99] it needs to calculate the values for A[98] and G[98]. This repeats over and over and the number of calculations becomes very large. Worse, Even worse, Plot wants to find many many points, not just 100 and 99, but 100 and 99.98 and 99.97.
This only calculates the first ten integer points, but still takes time.
Clear[A, G, T, Y, x];
A[x_] := Piecewise[{{30, x<1}, {G[x-1]/25 - A[x-1]/25 + A[x-1], x>=1}}];
G[x_] := Piecewise[{{20, x<1}, {T[x-1]/25 - A[x-1]/50 + G[x-1]/50 + G[x- 1], x>=1}}];
T[x_] := Piecewise[{{15, x<1}, {A[x-1]/25 - A[x-1]/75 + G[x-1]/75 + T[x-1]/75 + T[x-1], x>=1}}];
Y[x_] := Piecewise[{{35, x<1}, {A[x-1]/25 - A[x-1]/75 + G[x-1]/75 + T[x-1]/75 + Y[x-1], x>=1}}];
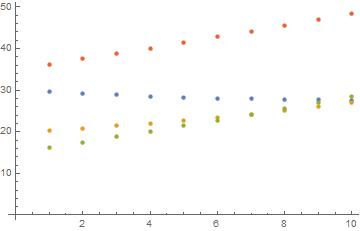
ListPlot[Transpose[Table[{A[x], G[x], T[x], Y[x]}, {x, 1, 10}]]]
This is a very different, and likely more difficult to understand, way of trying to solve the problem
Clear[A, G, T, Y, x];
f = {A[x], G[x], T[x], Y[x]} /. RSolve[{
     A[x] == G[x-1]/25. - A[x-1]/25 + A[x-1], A[0] == 30,
     G[x] == T[x-1]/25. - A[x-1]/50 + G[x-1]/50 + G[x-1], G[0] == 20,
     T[x] == A[x-1]/25. - A[x-1]/75 + G[x-1]/75 + T[x-1]/75 + T[x-1], T[0] == 15,
     Y[x] == A[x-1]/25. - A[x-1]/75 + G[x-1]/75 + T[x-1]/75 + Y[x-1], Y[0] == 35},
     {A[x], G[x], T[x], Y[x]}, x];
g2 = Plot[f, {x, 0, 100}]
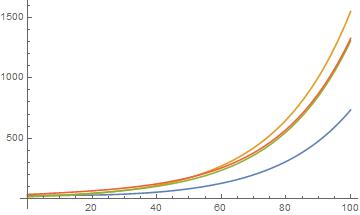
There are some perhaps serious risks associated with this method. If you look carefully you will see that I introduced four decimal points into that. These instruct Mathematica to use floating point approximations in the calculations and that results in many very tiny complex values introduced into the result. Perhaps surprisingly, Plot does not object to these small complex values.
Please use this with caution. And, as always, carefully check the results for correctness. Look up each of the functions in the help system and see if you can understand how these were done.


