Please notice how Mathematica code is formatted on this site and follow this formatting.
About your question. I am not sure why are you complicating things - first let's figure out how to do it for a single data set. Then you can generalize for all curves. Define a function:
f[data_] := {Thickness[.01], Opacity[.9], CapForm["Round"], ColorData["Rainbow"][#2], Line[#1]} & @@@
Transpose[{Partition[data, 2, 1], Rescale[Differences[data[[All, 2]]]]}]
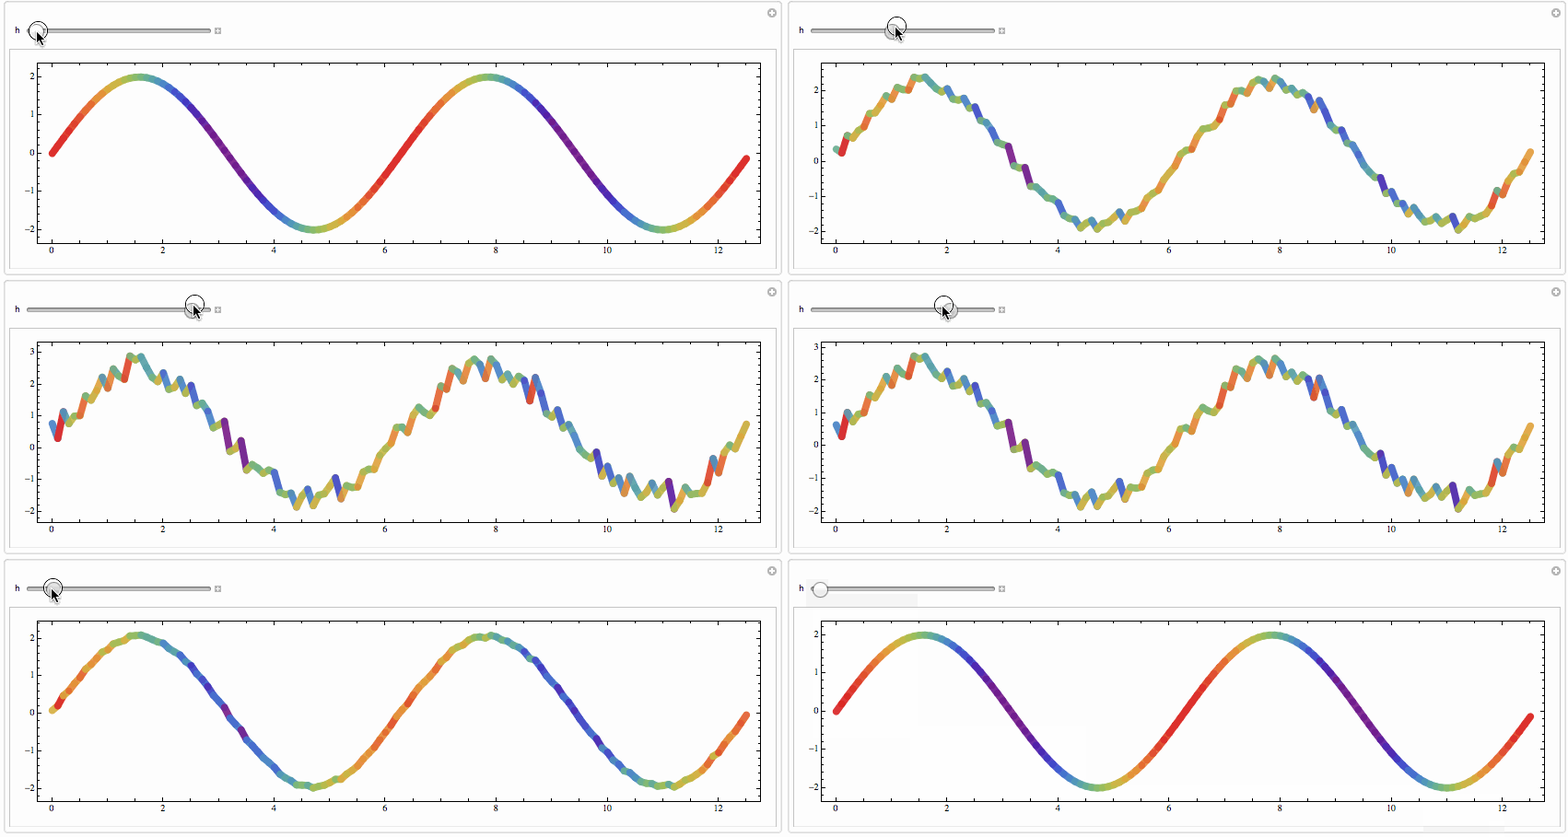
Now visualize. Note I am adding noise to show the effect changing of slope has on color
Manipulate[
SeedRandom[1];
data = Table[{x, 2 Sin[x] + RandomReal[h]}, {x, 0, 4 Pi, .1}];
Graphics[f[data], Frame -> True, ImageSize -> 800, AspectRatio -> 1/4]
, {h, 0, 1}]
