Introduction
Elections are fundamental to our democracies and way of life. The electorate bestows power on the lawmakers and public officials whose legitimisation is derived solely from the fact that they are elected. In recent times, many elections, such as the presidential elections the United States and the Brexit and general elections in the United Kingdom have seen a very pronounced polarisation the electorate. Can mathematics and the Wolfram Language help to better understand this crucial process of the most fundamental decision making process in societies? The main question I want to discuss in a sequence of posts is what can be learnt from elections. So this post is about computational politics.
It is important to notice that democracies rely on a general acceptance of the result of elections. Without that consensus a peaceful co-existence is at risk. Societies agree on certain electoral procedures and the results have to be understood to be final. There are, however, more fundamental questions such as how do we derive the "voters will" from ballots. That is a highly non-trivial problem. Also, elected politicians often claim that they represent the "will of the people". But is that true and what is the "will of the people"? Hence, my question: the voters have spoken - but what did they say?
This is the first of a series of posts (hopefully):
- Electoral systems - interpreting the will of the voters
- Gerrymandering - shaping the voters' will to your liking
- Analysis of the Brexit vote - how do we know what did the voters really want?
I apologise because there won't be any nice graphics in this post, but I find the results relevant anyway. In the following posts we will apply some more sophisticated algorithms to try to figure out what the voters meant to tell us. We will then see that we can use mathematics to estimate what the voters might have wanted to tell us; and then we can correct for that.

Note, that this cannot be the procedure by which we determine the decision that the electorate have taken. This is all a bit confusing, but I hope that it will become a bit clearer in these posts.
All posts were developed with Bjoern Schelter, who is also a member of this community. The definitions and main ideas for this post were taken from the excellent book "Mathematics And Politics: Strategy, Voting, Power, and Proof" by Alan Taylor, a text which I highly recommend. It is a treasure trove of ideas and concepts for anyone interested in this ares. It goes far beyond what is described in this post.
Social choice procedure
It turns out that reading the voters' will from a ballot is much more complicated than one might think - in many situations it is impossible (mathematically provable!) to do so in a "good" way. Let's define some words first. Let's assume that each voter ranks some alternatives in their preferred order.
Definition: A social choice procedure is a function for which a typical input is a sequence of lists (without ties) of some set A (the set of alternatives) and the corresponding output is either an element of A, a subset of A, of "No Winner".
There is a beautiful theorem by May (1952): Theorem: If the number of people is odd and each election produces a unique winner, then the majority rule is the only social choice procedure for two alternatives that satisfies the following three conditions:
- It treats all the voters the same: If any two voters exchange their ballots, the outcome of the election is un-effected.
- It threats both alternatives the same: If every voter reverses his or her vote (changing a vote for a to a vote for b and vice versa), the the election outcome is reversed as well.
- It is monotone: If some voter were to change his or her ballot from a vote for the loser to a vote for the winner, then the election outcome would be unchanged.
Six examples of social choice procedures
Let us assume that we have several alternatives to be voted for:
alternatives = {a, b, c}
Then there are the voting lists of the voters. They form the ballots:
ballots = Table[RandomSample[alternatives, Length[alternatives]], {k, 4}]
(*{{a, b, c}, {c, b, a}, {a, b, c}, {a, b, c}}*)
Condorcet's method:
An alternative x is among the winners if for any other alternative y, at least half of the voters rank x over y on their ballots.
This is an implementation of this social choice function:
condorcetindiv[ballots_List, a_, b_] :=
 Module[{},
  If[a === b, "NA",
   If[#[[1, 2]] >= Length[ballots]/2, {a, b}, #[[-1, 1, 1]]] &@
    SortBy[Tally[Select[#, # == a || # == b &] & /@ ballots], Last]]]

condorcet[ballots_List, alternatives_] :=
 Module[{},
  If[Max[#] >= Length[ballots],
     alternatives[[
      Flatten[Position[#, Max[#]]]]], {}] &@(Count[
       Flatten[Outer[condorcetindiv[ballots, #1, #2] &, alternatives,
         alternatives], Infinity], #] & /@ alternatives)]
Given the ballots and the alternatives we can now compute the social choice by applying the function condorcet:
condorcet[ballots, alternatives]
{a}
Note, that the social choice is given as a list, because it is not necessarily unique. This will become important later on.
Plurality:
Declare the social choice(s) the alternative(s) with the largest number of first-place rankings in the ballot list.
This is the respective implementation:
plurality[ballots_] :=
 Module[{}, GatherBy[SortBy[Tally[ballots[[All, 1]]], Last], Last][[-1, All, 1]]]
The social choice is computed like this:
plurality[ballots]
(*{a}*)
Borda Count
We award points to the n alternatives in a ballot as follows: the alternative at the bottom receives zero points; the one next to it receives one point and so on up to the alternative on the top of the list which receives (n-1) points.
This is the implementation of the social choice function:
bordacount[ballots_, alternatives_] :=
 Module[{}, GatherBy[SortBy[Total[Flatten[{Reverse[Range[0, Length[alternatives] - 1]]*Transpose[ballots]}]] /. {Plus -> List, Times -> List},
 First], First][[-1, All, 2]]]
which can be applied like so:
bordacount[ballots, alternatives]
(*{a}*)
Hare System
The procedure is as follows: we delete the alternative(s) that is on top of the fewest of the individual preference lists. The resulting individual preference lists are at least one shorter than before. We then repeat this process; the last alternative(s) is/are the winner(s).
Our Wolfram Language is
haresystem[ballots_] :=
 Module[{},
  Sort[DeleteDuplicates[Flatten[If[Length[#[[-1, 1]]] > 0, #[[-1, 1]], #[[-2, 1]]] &@
  NestWhileList[((# //. (# -> Nothing & /@ Complement[alternatives, #[[All, 1]]])) //. (# -> Nothing & /@
  GatherBy[SortBy[Tally[#[[All, 1]]], Last], Last][[1, All, 1]])) &, ballots, Length[DeleteDuplicates[Flatten[#, Infinity]]] > 1 &]]]]]
which is evaluated like so:
haresystem[ballots]
(*{a}*)
Sequential pairwise voting
We start with a fixed order of alternatives {a,b,c,d,..}. The first alternative is evaluated against the second in a one-to-one contest. The winning alternative (or both if there is a tie) then is compared to the third alternative. An alternative is deleted at the end of any round if it loses a one-to-one contest.
We will use a new ballot for the evaluation for clarity:
alternatives = {a, b, c, d}
ballots = Table[RandomSample[alternatives, Length[alternatives]], {k, 4}]
(*{{d, b, a, c}, {d, a, c, b}, {d, c, b, a}, {b, d, c, a}}*)
We also need a fixed agenda:
fixedagenda = alternatives[[RandomSample[RandomSample[Range[Length[alternatives]]]]]] ({a, b, c, d})
The social choice function is then implemented like so:
concorcetindivloser[ballots_List, bin_, acomp_] :=
 Module[{},
  If[acomp === bin,
   "NA", (Which[#1[[1, 2]] === Length[ballots]/2, {"W",
        "W"}, #1[[-1, 1, 1]] === bin, "W", True, "L"] &)[
    SortBy[Tally[(Select[#1, #1 == acomp || #1 == bin &] &) /@
       ballots], Last]]]]

seqpair[ballots_, fixedagenda_] :=
 Module[{winners = {fixedagenda[[1]]}},
  Do[AppendTo[winners, fixedagenda[[k]]];
   winners =
    Pick[winners, ! MemberQ[Flatten[#], "L"] & /@
        Outer[concorcetindivloser[ballots, #1, #2] &, #, #] &@
      winners], {k, 2, Length[fixedagenda]}]; winners]
We can evaluate this like so:
seqpair[ballots, fixedagenda]
(*{b}*)
Dictatorship
One of the voters is chosen and called "dictator". The alternative on top if their individual preference list is the social choice.
We can implement this function like so:
dictatorhip[ballots_, k_] := {ballots[[k, 1]]}
where $k$ is the index of the person who is the "dictator".
dictatorhip[ballots, 3]
(*{d}*)
A closer look at the social choice procedures
All of these social choice functions are implemented in different parts of the world. It turns out that they have the curious habit of not agreeing on the social choice even if the ballots are the same!
Let's suppose we have the following ballots:
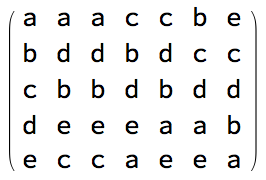
ballots = {{a, b, c, d, e}, {a, d, b, e, c}, {a, d, b, e, c}, {c, b, d, e, a}, {c, d, b, a, e}, {b, c, d, a, e}, {e, c, d, b, a}};
So there are 7 voters and the lists are the preference lists of them. Here is another representation:
Transpose@ballots // MatrixForm

Let's apply Condorcet's method first:
condorcet[ballots, alternatives]
(*{}*)
That means that Condorcet's method does not produce a social choice. This is obviously a critical problem of a social choice function, because it would not be suitable to lead the decision making process to a conclusion.
Let's try the plurality rule:
plurality[ballots]
(*{a}*)
It determines that the social choice is a. So the electorate has decided for alternative a.
Next up: the Borda Count:
bordacount[ballots, alternatives]
(*{b}*)
So according to the Borda Count b is the winner - in spite of the ballots not having changed!
What about the Hare system?
haresystem[ballots]
(*{c}*)
Next up, the sequential voting system. Let's choose the fixed agenda
fixedagenda = {a, b, c, d, e};
We then obtain:
seqpair[ballots, fixedagenda]
(*{d}*)
So under this social choice function d is the winner.
Last the dictatorship. Let's make person 7 the dictator:
dictatorhip[ballots, 7]
(*{e}*)
Now, e is the winner. Curious...
So in this simple case existing social choice procedures would have led to all different alternatives in spite of the ballots being exactly the same. This is a bit frightening because all these systems are actually being used today.
Optimal social choice procedure
The question is whether there is an "optimal" social choice procedure. The answer to that question turns out to be no. First we define the following five desirable properties:
- Always a winner. The procedure should always produce a winner. We have already seen that for example Condorcet's method does not give a winner for the last example.
- Condorcet winner criterion. A social choice procedure is said to satisfy the Condorcet winner criterion (CWC) provided that[LongDash]if there is a Condorcet winner[LongDash]then it alone is the social choice.
- Pareto condition. A social choice procedure is pareto if for every pair x and y of alternatives we have: If everyone prefers x to y, then y is not a social choice.
- Monotonicity. A social choice procedure is monotone if for any x the following holds: If x is the social choice (or tied for such) and someone changes his or her preference list by moving x up one spot (that is, exchanging x's position with that of the alternative immediately above x on his or her list), then x should still be the social choice (or tied for such).
- Independence of Irrelevant Alternatives. For every pair of alternative x and y we have: If the social choice set includes x but not y, and one or more voters change their preferences, but no one changes his or her mind about whether x is preferred to y or y to x, then the social choice set should not change so as to include y.
These are very (!) desirable properties and reasonable requirements. Unfortunately, the following theorem holds:
THEOREM. There is no social choice procedure for three or more alternatives that satisfies the always-a-winner criterion, independence of irrelevant alternatives, and the Condorcet winner criterion.
There is also a more general theorem by Arrow, that -roughly speaking- that there cannot be a social choice function fulfilling some basic properties.
What happens for larger constituencies?
Let's create a larger set of voters and hence individual preference lists.
alternatives = {a, b, c, d, e};
and
constituency = Table[RandomSample[alternatives], 200];
Condorcet:
condorcet[constituency, alternatives]
(*{}*)
Plurality:
plurality[constituency]
(*{b}*)
Borda count:
bordacount[constituency, alternatives]
(*{e}*)
Hare system:
haresystem[constituency]
(*{d}*)
Sequential pairwise:
fixedagenda = alternatives[[RandomSample[RandomSample[Range[Length[alternatives]]]]]];
(*{e}*)
That is not very encouraging. But perhaps the outcomes depend on the population size?
Monitor[results =
   Table[{pop,
     Table[constituency = Table[RandomSample[alternatives], pop];
      fixedagenda =
       alternatives[[
        RandomSample[
         RandomSample[Range[Length[alternatives]]]]]]; {Length[
          DeleteCases[#, {}]], Length /@ #} &@
       Union[Sort /@ {condorcet[constituency, alternatives],
          plurality[constituency],
          bordacount[constituency, alternatives],
          haresystem[constituency],
          seqpair[constituency, fixedagenda]}], {50}]}, {pop, 10, 500,
      10}];, pop]
I have varied the population size of the electorate from 10 to 500 in steps of 10. The variable results looks like this (here for 500 voters):
results[[-1]]
(*{500, {{2, {0, 1, 1}}, {2, {0, 1, 2}}, {3, {0, 1, 1, 2}}, {1, {0,
    1}}, {3, {0, 1, 1, 1}}, {2, {0, 1, 1}}, {2, {0, 1, 1}}, {2, {0, 1,
     1}}, {3, {0, 1, 2, 2}}, {1, {0, 1}}, {2, {0, 1, 1}}, {2, {0, 1,
    1}}, {1, {0, 1}}, {1, {0, 1}}, {1, {0, 1}}, {3, {0, 1, 1,
    2}}, {4, {0, 1, 1, 2, 3}}, {1, {0, 1}}, {1, {0, 1}}, {1, {0,
    1}}, {1, {0, 1}}, {1, {0, 1}}, {3, {0, 1, 1, 2}}, {1, {0,
    1}}, {2, {0, 1, 1}}, {2, {0, 1, 2}}, {2, {0, 1, 1}}, {2, {0, 1,
    1}}, {2, {0, 1, 1}}, {1, {0, 1}}, {2, {0, 1, 3}}, {1, {0,
    1}}, {3, {0, 1, 1, 1}}, {1, {0, 1}}, {2, {0, 1, 1}}, {2, {0, 1,
    1}}, {2, {0, 1, 2}}, {1, {0, 1}}, {3, {0, 1, 1, 1}}, {2, {0, 1,
    1}}, {2, {0, 1, 1}}, {3, {0, 1, 1, 2}}, {3, {0, 1, 1, 1}}, {2, {0,
     1, 1}}, {4, {0, 1, 1, 1, 2}}, {1, {0, 1}}, {2, {0, 1,
    1}}, {2, {0, 1, 1}}, {1, {0, 1}}, {2, {0, 1, 1}}}}*)
The first 500 is the number of voters. Then there are 50 "realisations", i.e. 50 independent elections where voters make random choices. Each of the 50 sublists has a first entry which gives the number of different results using different social choice functions and ignoring empty sets, i.e. "no-winner" scenarios. Let's plot the histogram of the number of different outcomes using the various social choice functions:
Histogram[results[[-1, 2, All, 1]],
 AxesLabel -> {"number of different outcomes", "number of elections"},
  ImageSize -> Large, LabelStyle -> Directive[Bold, Medium]]
So in most cases the social choice functions give different results, even if there are 500 voters. Then we can count how many winners there are in cases of different results:
results[[-1, 2, All, 2]]
(*{{0, 1, 1}, {0, 1, 2}, {0, 1, 1, 2}, {0, 1}, {0, 1, 1, 1}, {0, 1,
  1}, {0, 1, 1}, {0, 1, 1}, {0, 1, 2, 2}, {0, 1}, {0, 1, 1}, {0, 1,
  1}, {0, 1}, {0, 1}, {0, 1}, {0, 1, 1, 2}, {0, 1, 1, 2, 3}, {0,
  1}, {0, 1}, {0, 1}, {0, 1}, {0, 1}, {0, 1, 1, 2}, {0, 1}, {0, 1,
  1}, {0, 1, 2}, {0, 1, 1}, {0, 1, 1}, {0, 1, 1}, {0, 1}, {0, 1,
  3}, {0, 1}, {0, 1, 1, 1}, {0, 1}, {0, 1, 1}, {0, 1, 1}, {0, 1,
  2}, {0, 1}, {0, 1, 1, 1}, {0, 1, 1}, {0, 1, 1}, {0, 1, 1, 2}, {0, 1,
   1, 1}, {0, 1, 1}, {0, 1, 1, 1, 2}, {0, 1}, {0, 1, 1}, {0, 1,
  1}, {0, 1}, {0, 1, 1}}*)
So all cases contain cases of "no winner", when there is a zero in the sublist. This comes mostly from Condorcet's method, which often does not give a winner. The ones indicate that in the respective outcomes there was only one winner. A two or three means that the winner was not unique, i.e. a tie. So basically of all the outcomes only the ones lead to a decision. So only
N[Count[#, 1]/Length[#]] &@Flatten[results[[-1, 2, All, 2]]]
(*0.568*)
57% of the cases lead to a unique winner. If we ignore the no-winner scenarios we see that only in
N[Count[#, 1]/Length[#]] &@(Length[#] - 1 & /@ results[[-1, 2, All, 2]])
(*0.34*)
about 34% of the cases the methods agree on the winner.
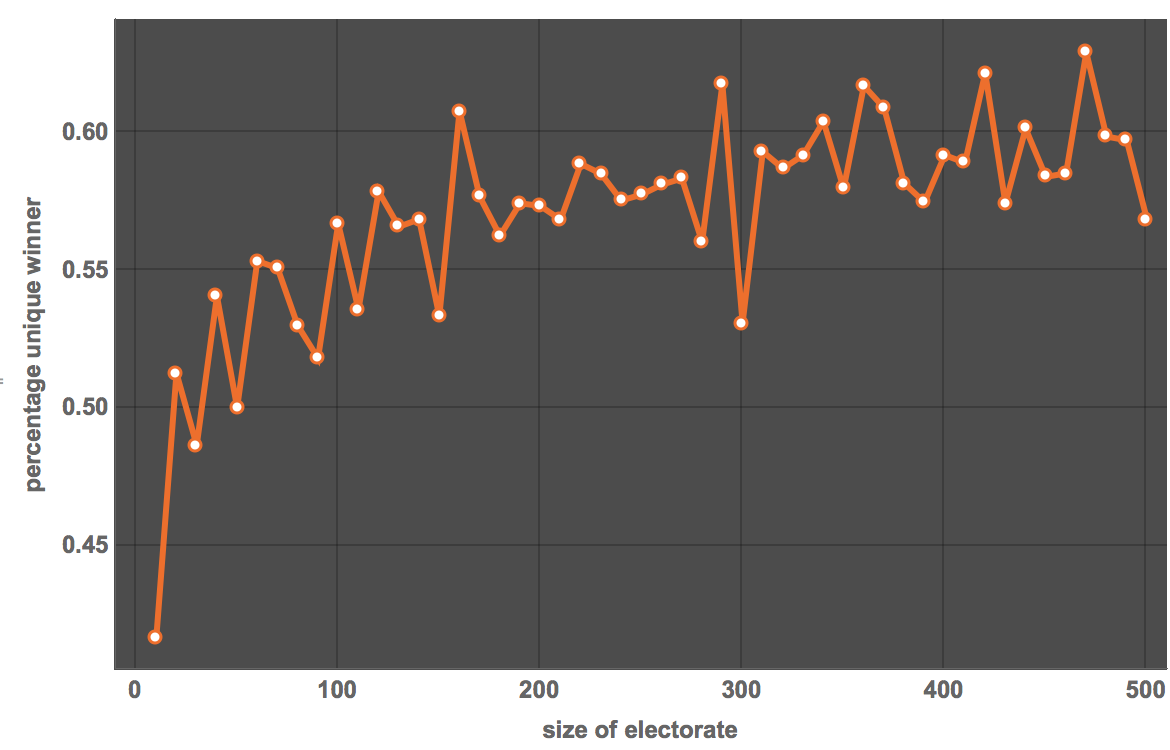
Let's see how these numbers change for different sizes of electorates. First, we compute the percentage of "unique winner scenarios" for different sizes of the electorate (ignoring no winner scenarios):
ListLinePlot[Table[{results[[k, 1]], N[Count[#, 1]/Length[#]] &@Flatten[results[[k, 2, All, 2]]]}, {k, 1, 50}],
FrameLabel -> {"size of electorate", "percentage unique winner"}, LabelStyle -> Directive[Bold, Medium], ImageSize -> Large,
PlotTheme -> "Marketing"]

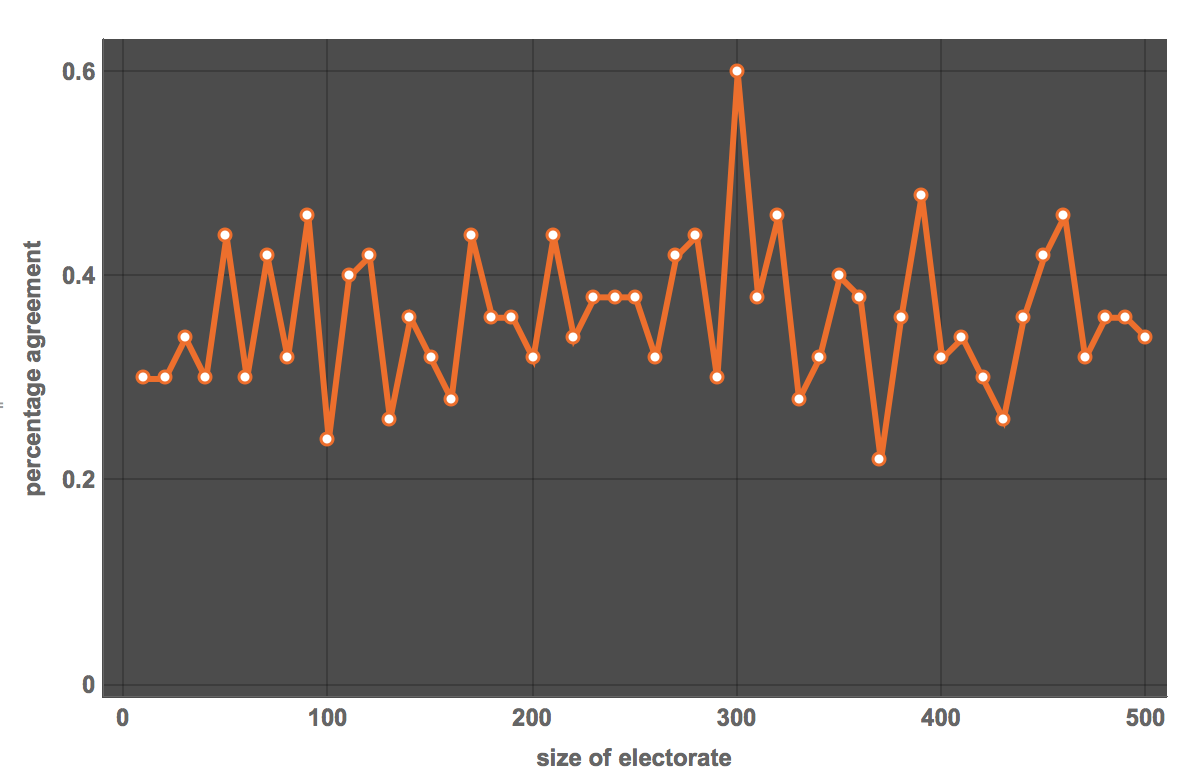
With a bit more CPU time, we can study whether there is a saturation effect for larger population sizes... Let's look at the agreement of the different social choice procedures:
ListLinePlot[Table[{results[[k, 1]], N[Count[#, 1]/Length[#]] &@(Length[#] - 1 & /@ results[[k, 2, All, 2]])}, {k, 1, 50}],
FrameLabel -> {"size of electorate", "percentage agreement"},
LabelStyle -> Directive[Bold, Medium], ImageSize -> Large, PlotTheme -> "Marketing"]

So, more often than not, the social choice procedures to not agree on the winner. This might suggest a type of independence of the population size.
Conclusion
Even if the ballots are fixed deciding what the voters meant to say is by no means trivial. "Reading" the voters' minds even if they have spoken is mathematically speaking very problematic. For the case of only two alternatives (Brexit/No-Brexit) and an odd number of voters the thing appears to be easier, but as we will see later, there are many more issues.
This is not meant to say that we should give up or ignore the outcome of elections. To maintain order and piece as a society we need to agree on a particular social choice procedure and accept the outcome. We need to take decisions and these decisions have to be based on established rules. The only issue is that sometimes the social choice ("will of the people") depends on the social choice function and not solely on the ballots!
We have a type of "societal contract" to accept the outcome of elections under the rules (social choice function) that is agreed upon before the elections. This does not necessarily mean, however, that politicians can claim that this is the "will of the people"; it is the decision made based on a ballot and an agreed upon social choice procedure.