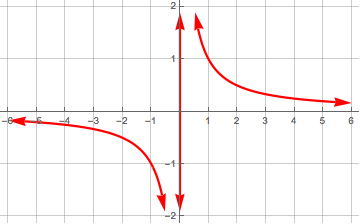
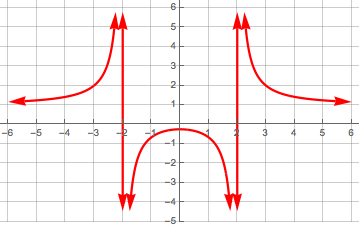
Please, could any body help me? I want to plot graphics of elementary rational functions like f(x)=1/x, or g(x)= (x^2+1)/(x^2-4), what I got is not correct. I have tried to indicate the intervals of the domain of the function with inequalities but it does not work, for instance for g(x): -6<x<-2, -2<x<2, 2<x<6. I understand is a problem with x values that make zero the denominator. I attach a file with the examples. Thank you very much.
Plot[f[x] = 1/x, {x, -6, 6}, PlotStyle -> Directive[RGBColor[1, 0, 0], AbsoluteThickness[2.25],
Arrowheads[{-.05, .05}]], GridLines -> {Range[-6, 6, 1], Range[-6, 6, 1]},
Ticks -> {Range[-6, 6, 1], Range[-6, 6, 1]}] /. Line -> Arrow
Plot[f[x] = (1 + x^2)/(-4 + x^2), {x, -6, 6}, PlotStyle -> Directive[RGBColor[1, 0, 0],
AbsoluteThickness[2.25], Arrowheads[{-.05, .05}]], GridLines -> {Range[-6, 6, 1], Range[-6, 6, 1]},
Ticks -> {Range[-6, 6, 1], Range[-6, 6, 1]}] /. Line -> Arrow
 Attachments:


