Dear Jorge,
I am not sure whether this helps, because I do not have your data, but here's an idea. Suppose we look at US zip codes in the range from 85001 to 85055. We can generate the Entities for these codes:
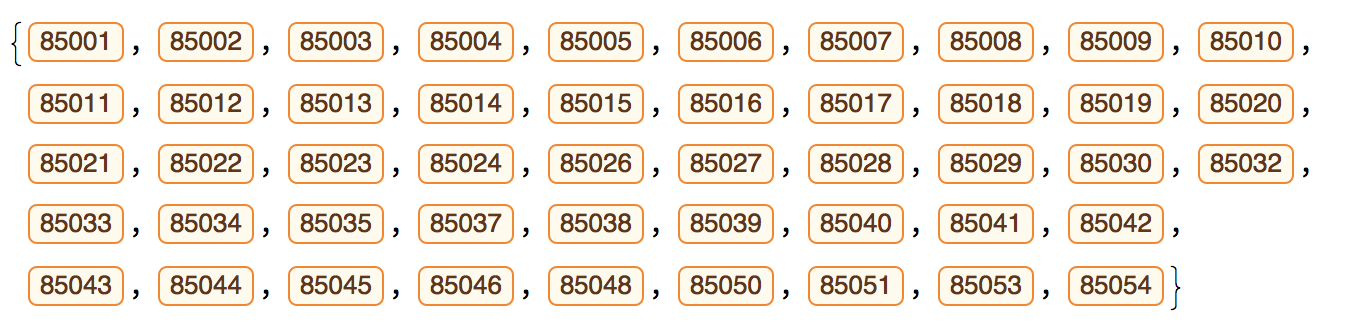
zipcodes = Cases[Interpreter["ZIPCode"][ToString /@ Range[85001, 85055]], _Entity]
Let's generate a list of fake numbers of people who did the test:
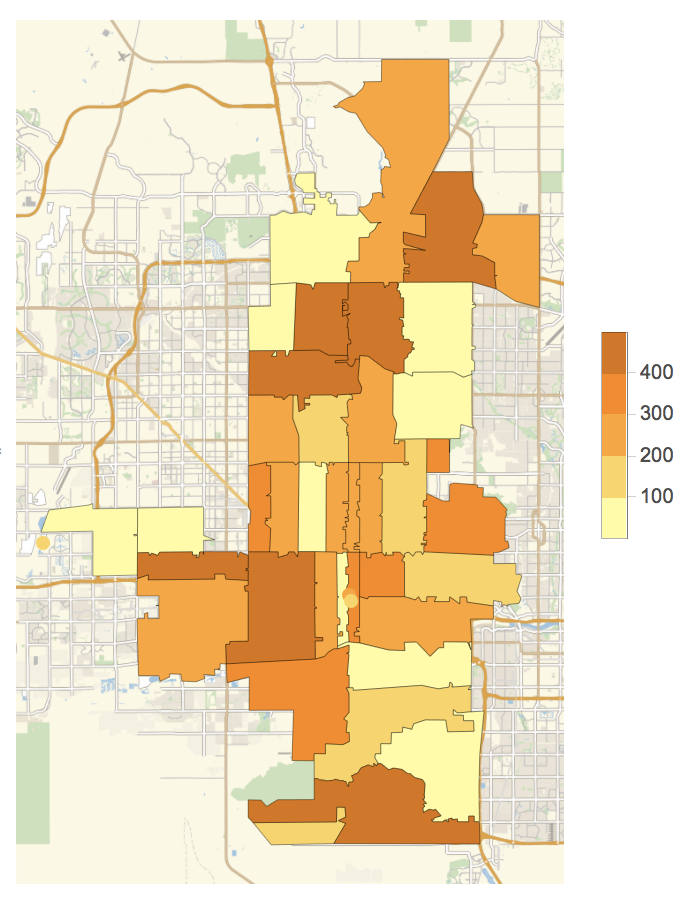
teststaken = RandomInteger[{1, 500}, Length[zipcodes]]
Then this should work:
GeoRegionValuePlot[Rule @@@ Transpose[{zipcodes, teststaken}]]
Hope this goes in the right direction.
Cheers,
Marco


