The Wolfram Community is now ~4.5 years 'old'. So time to do some analysis
let's go!
Let's download all the threads-titles, their votes, their authors et cetera:
SetDirectory[NotebookDirectory[]];
$HistoryLength=1;
xml=Import["http://community.wolfram.com/dashboard/-/discussions-list/all+groups/Any+discussions/none/active/full/10000/1/filter","XMLObject"];
Export["website.mx",xml]
This will save that output to website.mx file next to your notebook.
Here is a small function that extract the relevant data:
ClearAll[GetThreadProperties]
GetThreadProperties[threadxml_]:=Module[{url,title,creator,creatorurl,views,replies,votes},
    {url,title}=FirstCase[threadxml,XMLElement["h3",{"class"->"asset-title"},{_,XMLElement["a",{"shape"->"rect","href"->url_},{title_}],_}]:>{url,title},{Missing[],Missing[]},\[Infinity]];
    {creator,creatorurl}=FirstCase[threadxml,XMLElement["span",{"class"->"metadata-entry"},{_,XMLElement["span",{"class"->"asset-meta-bold"},{"CREATED BY: "}],_,XMLElement["span",{"class"->"asset-meta-normal"},{_,XMLElement["a",{"shape"->"rect","href"->creatorprofileurl_},{creator_}],_}],_}]:>{creator,creatorprofileurl},{Missing[],Missing[]},\[Infinity]];
    views=FirstCase[threadxml,XMLElement["div",{"class"->"views stats"},{_,XMLElement["div",{"class"->_},{views_}],_,XMLElement["div",{"class"->_},{"VIEWS"}],_}]:>views,Missing[],\[Infinity]];
    replies=FirstCase[threadxml,XMLElement["div",{"class"->"replies stats"},{_,XMLElement["div",{"class"->_},{replies_}],_,XMLElement["div",{"class"->_},{"REPLIES"}],_}]:>replies,Missing[],\[Infinity]];
    votes=FirstCase[threadxml,XMLElement["div",{"class"->"votes stats"},{_,XMLElement["div",{"class"->_},{votes_}],_,XMLElement["div",{"class"->_},{"VOTES"}],_}]:>votes,Missing[],\[Infinity]];
    views=If[StringEndsQ[views,"K"],1000ToExpression[StringDrop[views,-1]],ToExpression@views];
    replies=If[StringEndsQ[replies,"K"],1000ToExpression[StringDrop[replies,-1]],ToExpression@replies];
    votes=If[StringEndsQ[votes,"K"],1000ToExpression[StringDrop[votes,-1]],ToExpression@votes];
    <|"url"->url,"title"->title,"creator"->creator,"views"->views,"replies"->replies,"votes"->votes,"createrurl"->creatorurl|>
]
Import the data from the mx file, and then get the relevant values from it using the above function, store in a dataset:
tmp=Import["website.mx"];
tmp=Cases[tmp,XMLElement["div",{"class"->"asset-abstract default-asset-publisher","style"->_},___],\[Infinity]];
ds=Dataset[GetThreadProperties/@tmp];
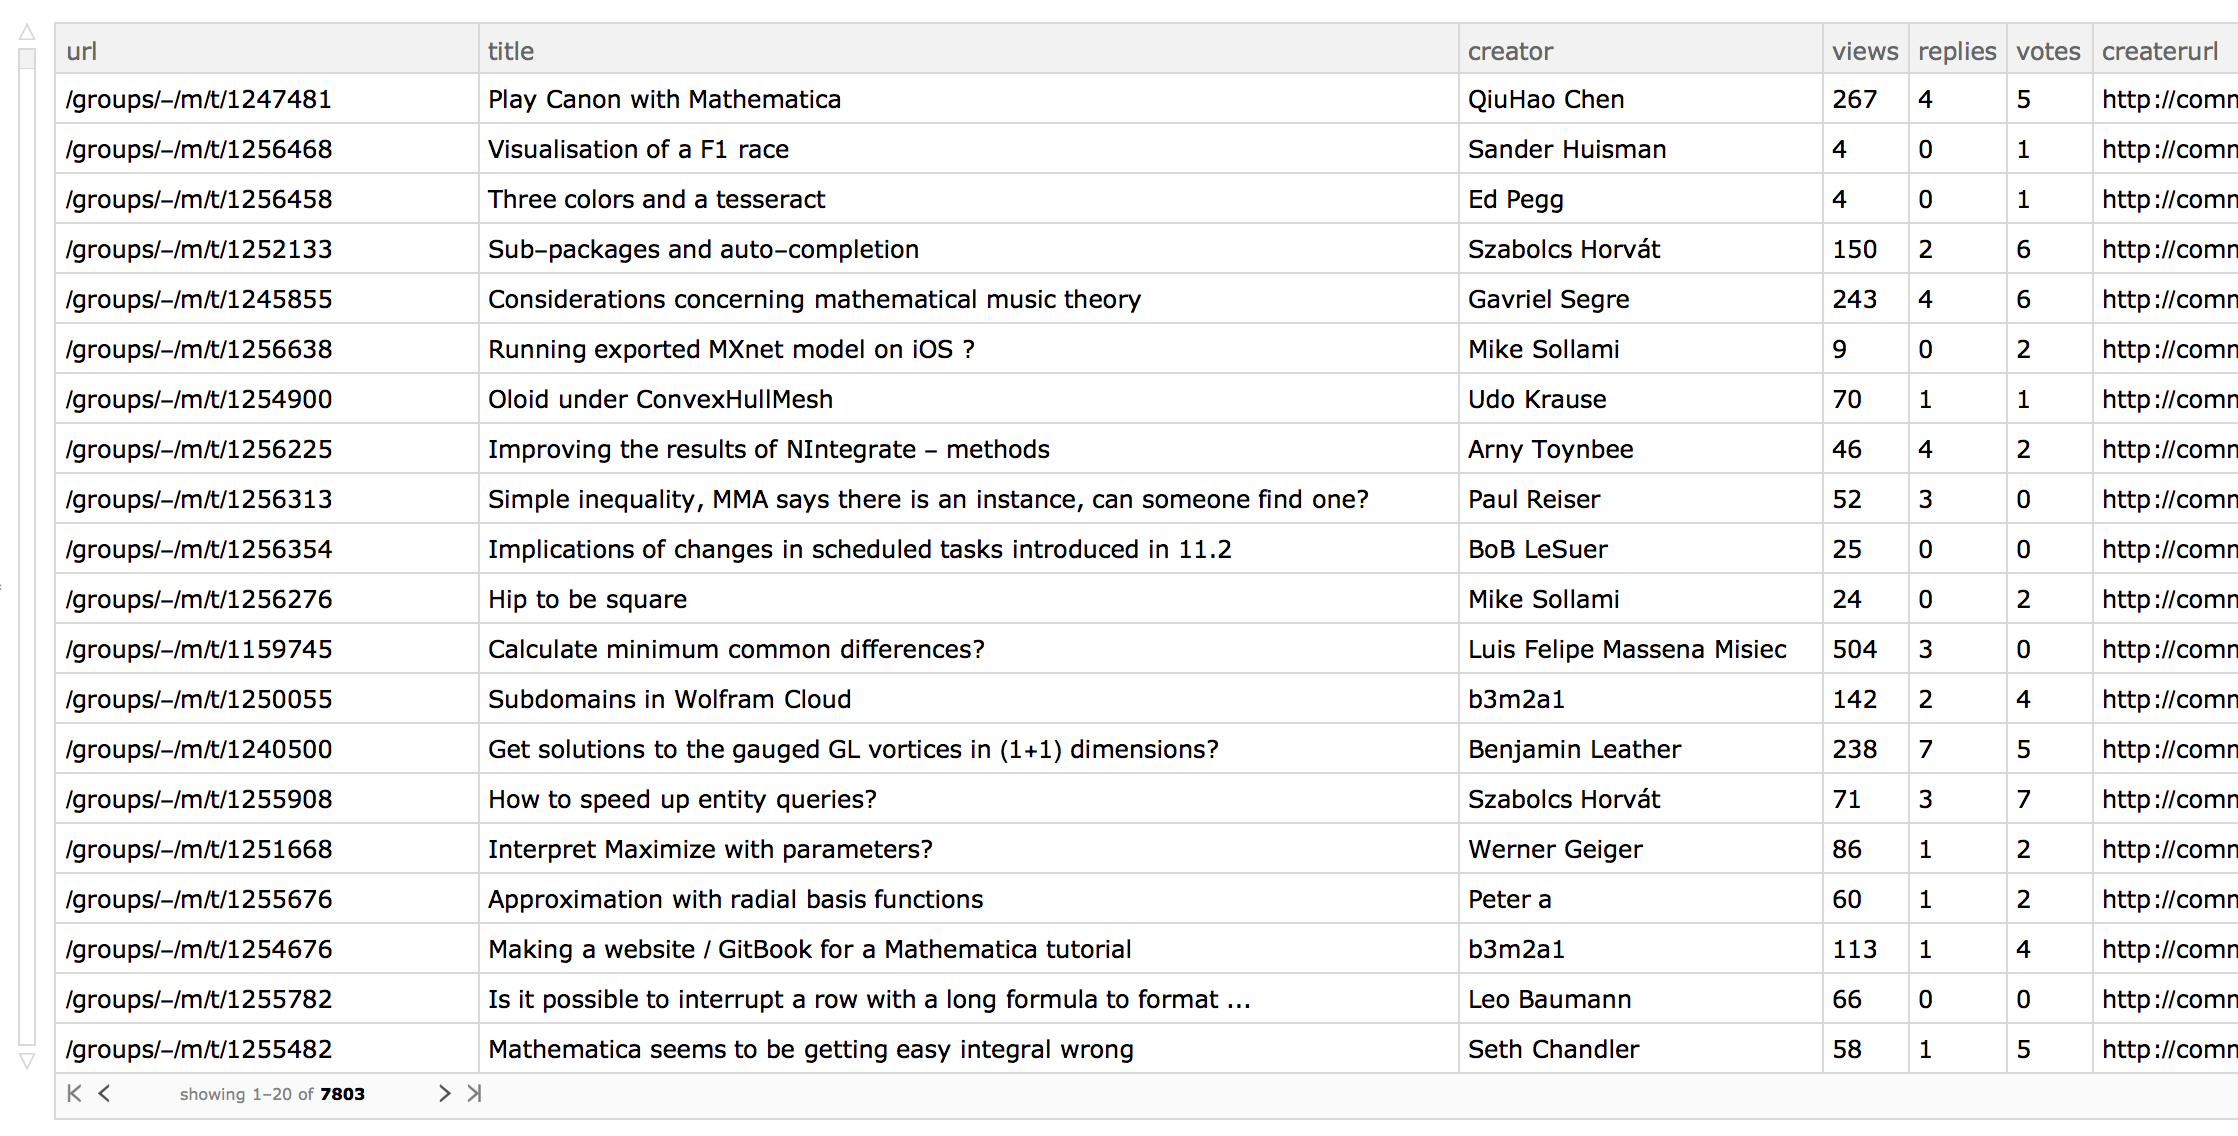
Here an example:
Let's start simple and get the number of threads, the number of views, votes, and replies:
Length[ds]
ds[Total,{"views","votes","replies"}]
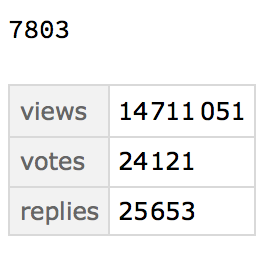
Nearly 8000 topics and nearing 15 mega-views!
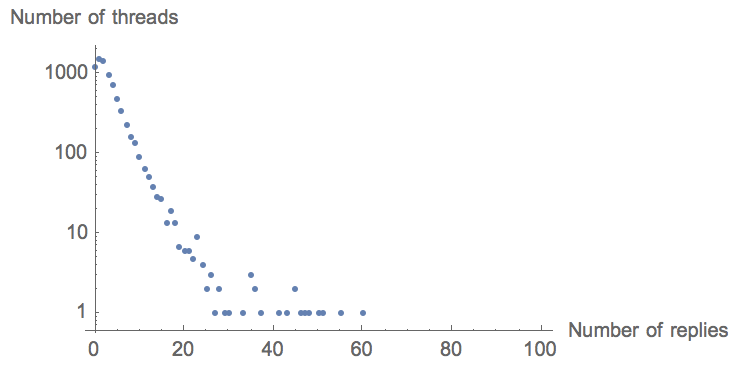
Let's check the number of replies for each topic:
ListLogPlot[Tally[Normal[ds[All, "replies"]]], AxesLabel -> {"Number of replies", "Number of threads"}]
giving:
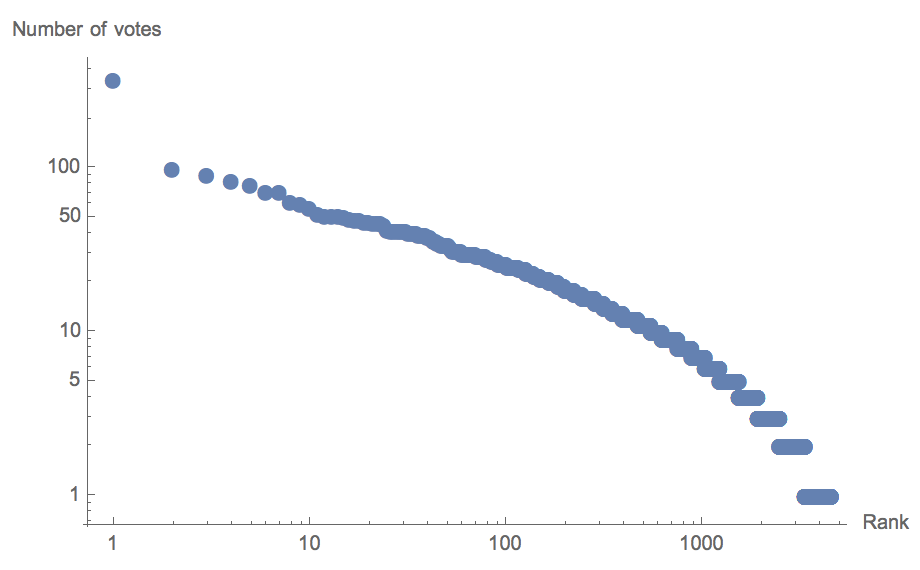
We can also plot the number of votes vs rank:
ListLogLogPlot[Flatten[Normal[Values[ds[Reverse@*SortBy[#votes&]][All,{"votes"}]]]],PlotRange->All,AxesLabel->{"Rank","Number of votes"},PlotMarkers->{Automatic,Medium}]
Let's look into my posts:
ds[Select[#creator=="Sander Huisman"&]/*Reverse@*SortBy[#votes&]]
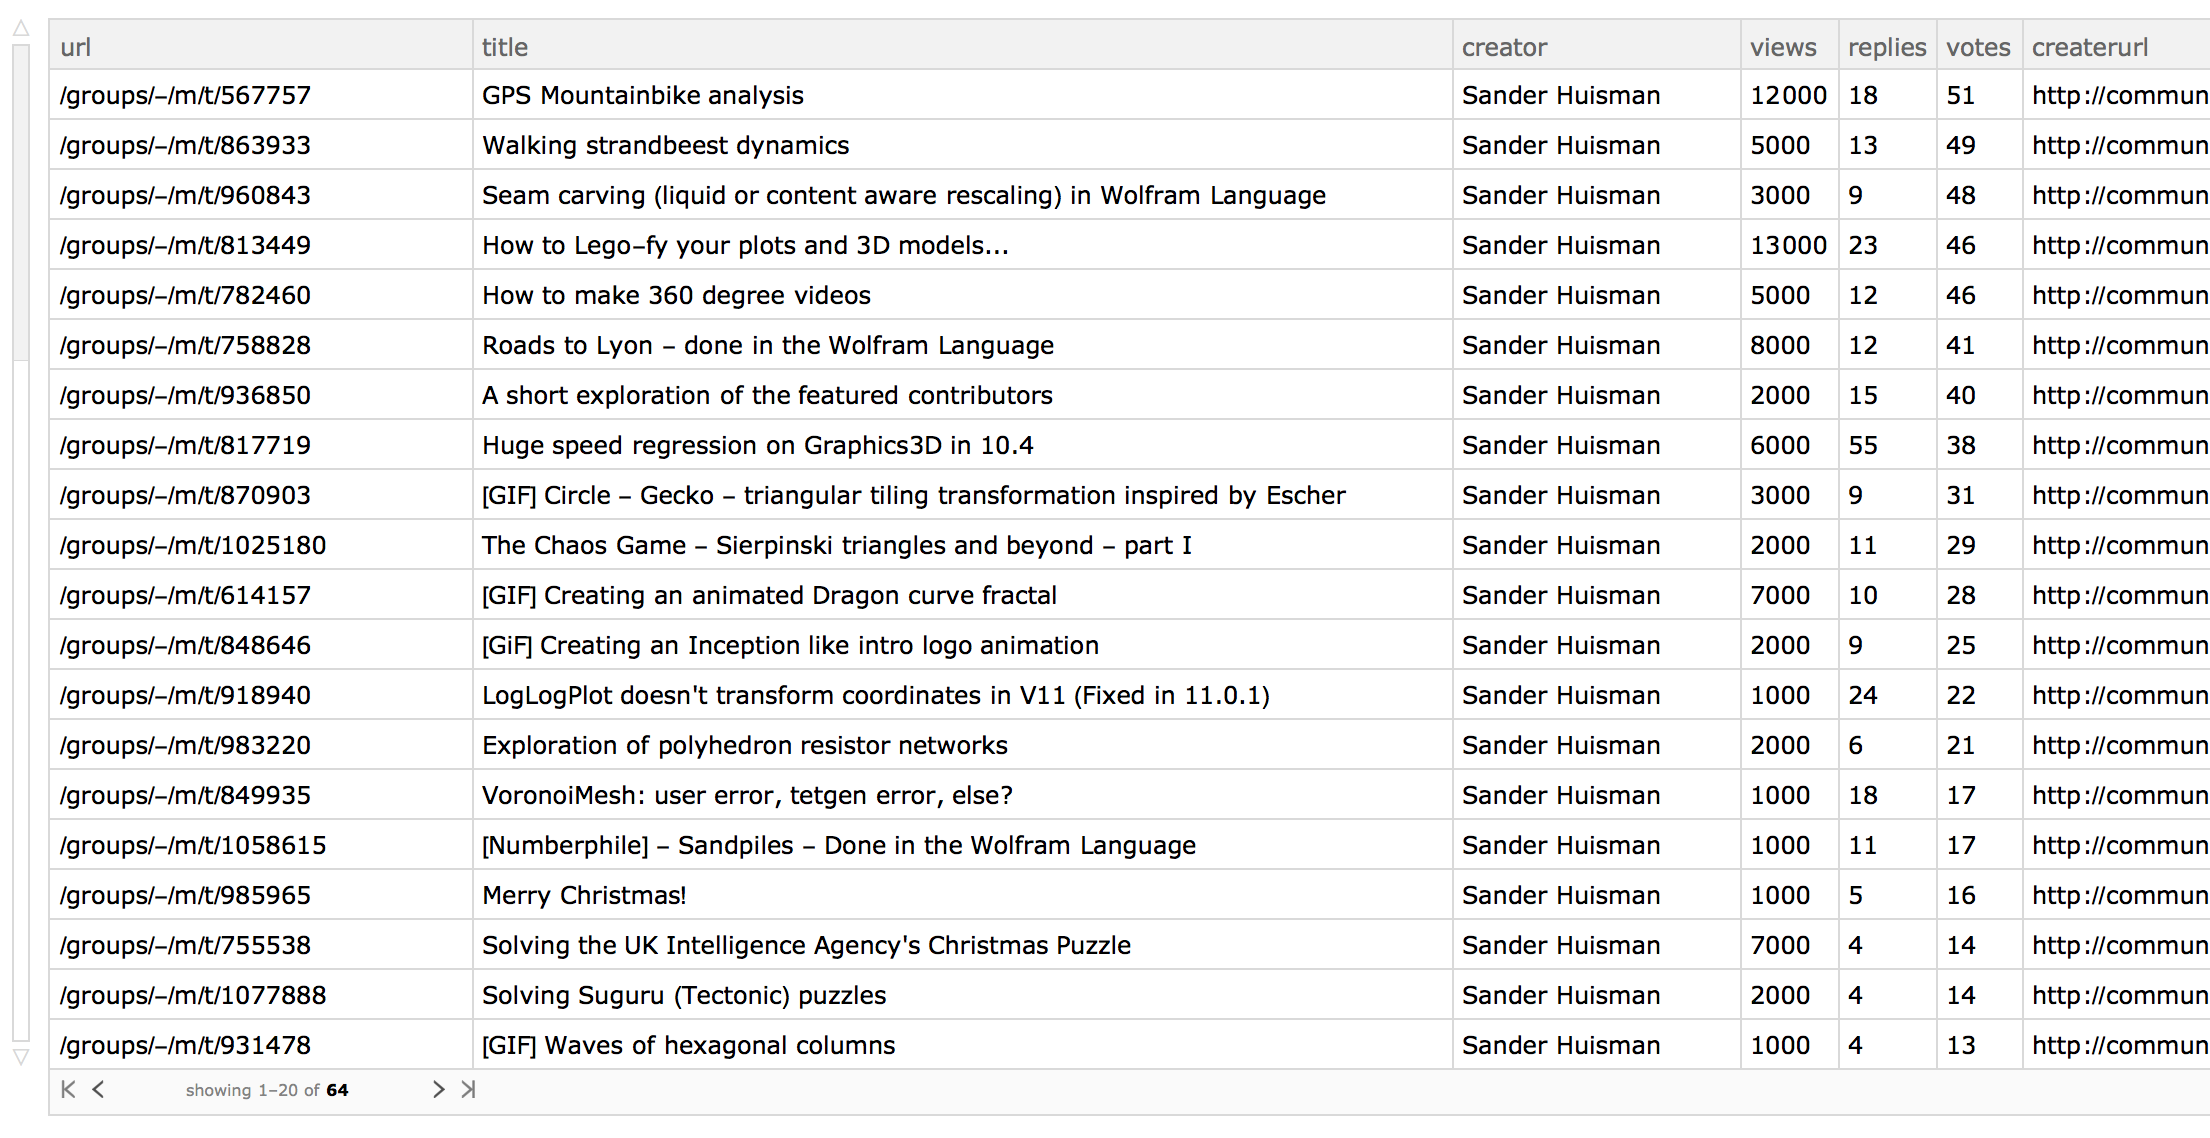
I'm very happy to see some of my posts got ~50 votes.
Let's have a look at the authors, who is the most active in making threads:
data=SortBy[Tally[Flatten[Normal[Values[ds[[All,{"creator"}]]]]]],Minus@*Last][[;;50]];
BarChart[Association[Rule@@@Reverse@data],ChartLabels->Automatic,BarOrigin->Left,Frame->True,PerformanceGoal->"Speed",AspectRatio->GoldenRatio/2,ChartStyle->Directive[EdgeForm[{Thickness[Medium],Black,Opacity[1]}],RGBColor[0,0.5,1]],FrameStyle->Black,FrameTicks->{{Automatic,Automatic},{All,All}},ImageSize->650,PlotRange->{0,160},PlotRangePadding->{None,{None,Scaled[0.01]}},BarSpacing->None,PlotLabel->Style["Number of threads",16,Black]]
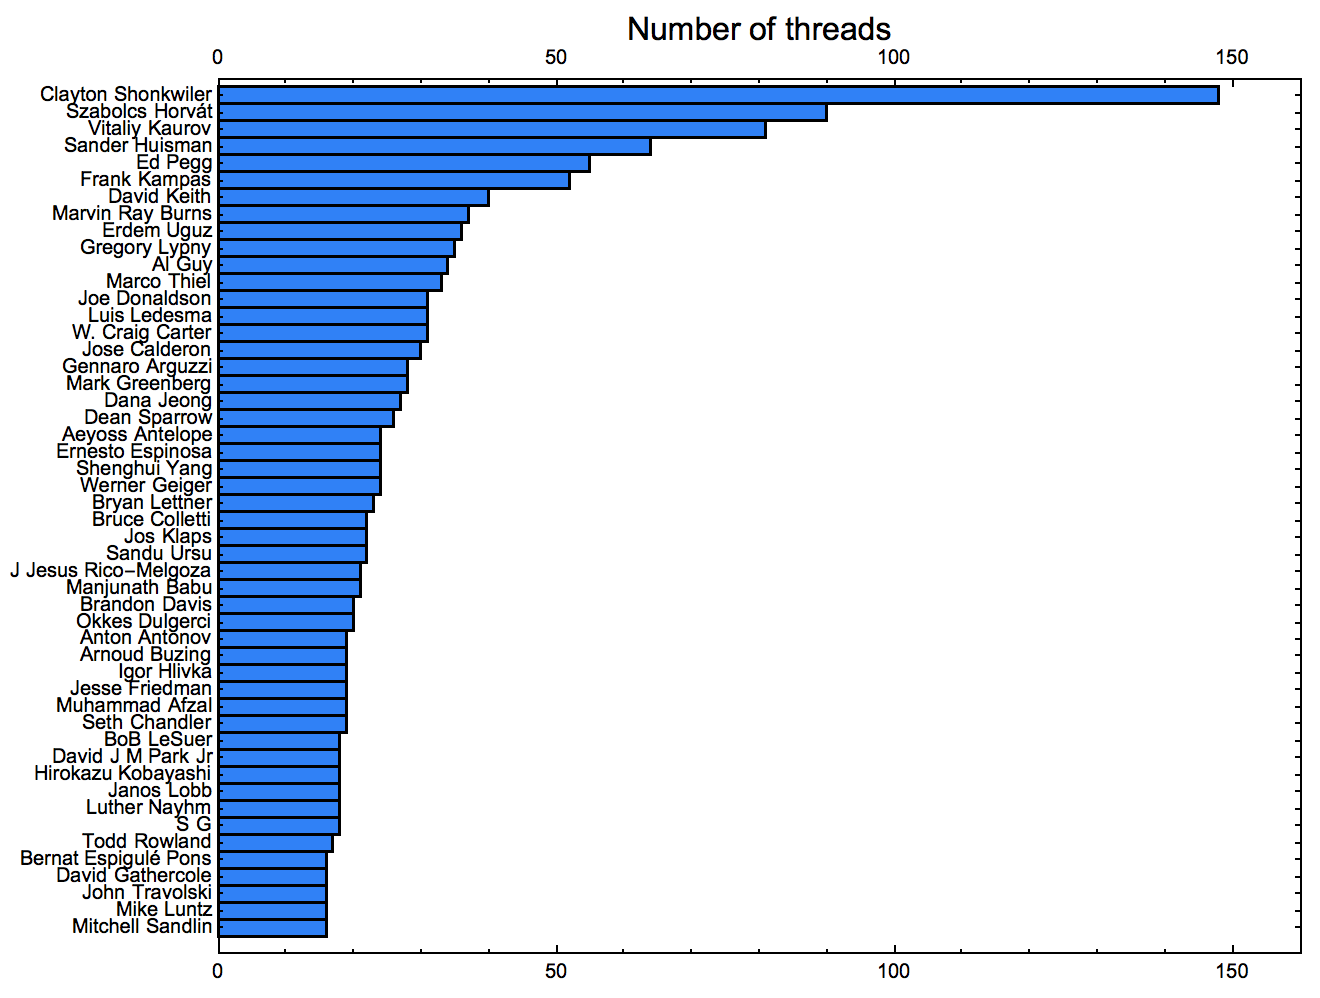
@Clayton Shonkwiler is by far the author with the most posts.
We can also check by number of votes:
BarChart[Sort[GroupBy[Normal[Values[ds[[All,{"creator","votes"}]]]],First->Last,Total]][[-100;;]],ChartLabels->Automatic,BarOrigin->Left,Frame->True,PerformanceGoal->"Speed",ScalingFunctions->"Log",AspectRatio->GoldenRatio,ChartStyle->Directive[EdgeForm[{Thickness[Medium],Black,Opacity[1]}],RGBColor[0,0.5,1]],FrameStyle->Black,FrameTicks->{{Automatic,Automatic},{All,All}},ImageSize->650,PlotRange->{20,3000},PlotRangePadding->{None,{None,Scaled[0.01]}},PlotLabel->Style["Total number of votes",16,Black]]
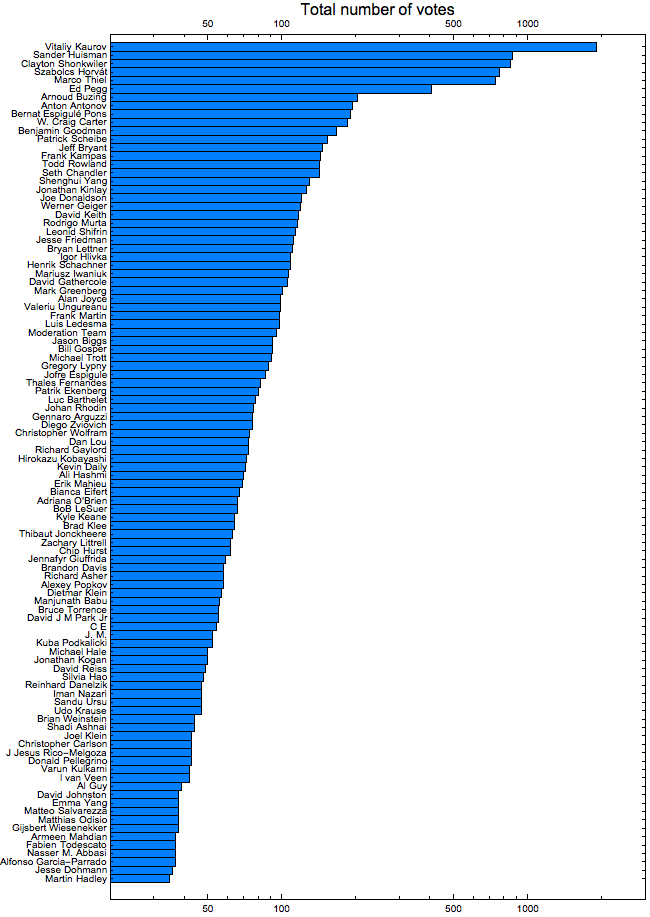
I was surprised to see I end up second in this list!
Finally let's make a word cloud of the topic-titles:
WordCloud[ToLowerCase[StringRiffle[Flatten[Normal[Values[ds[[All,{"title"}]]]]]]],MaxItems->150]

Hope you enjoyed this little exploration, even further analysis would be to download all the threads, but that would be quite the undertaking without access to the database directly