Click on the image to zoom. Then click your browser back button to return to reading the post.
Intro
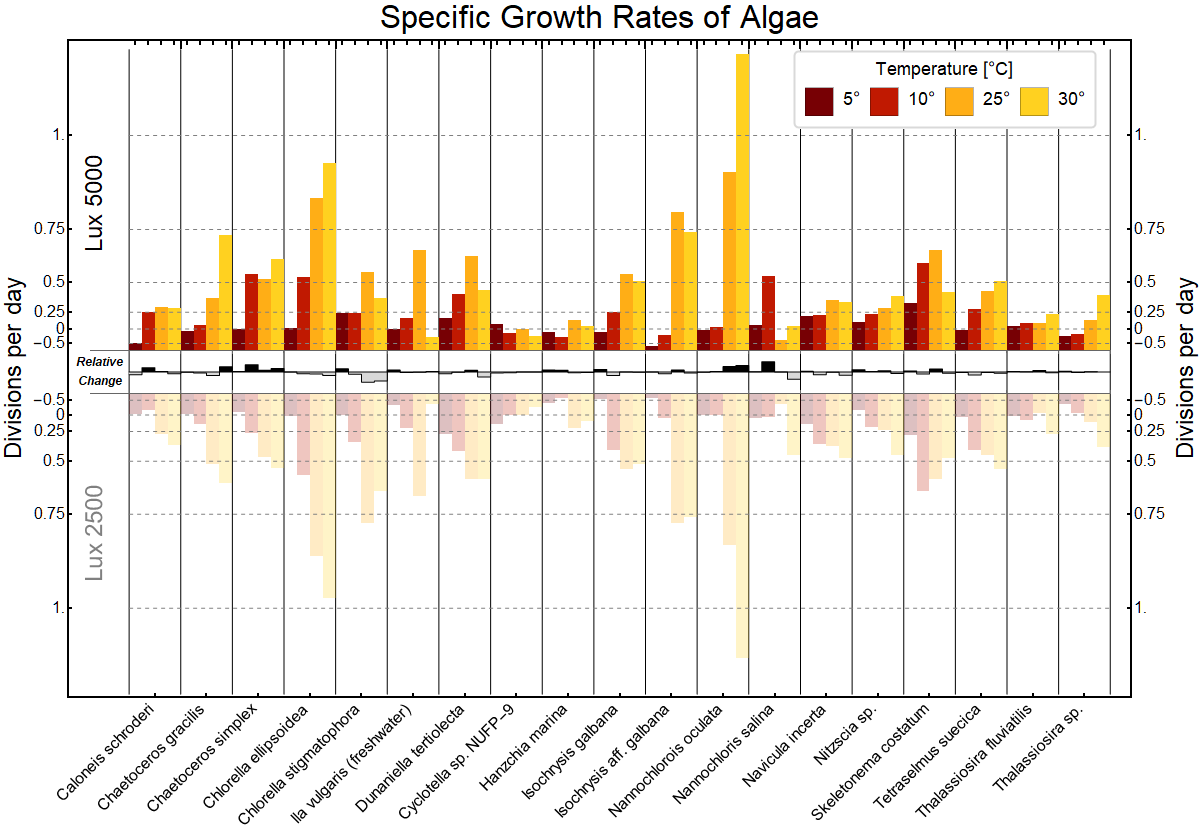
This is a response to the [CALL] Reddit DataViz Battle JAN2018: Visualize the Growth Rates of Algae:
http://community.wolfram.com/groups/-/m/t/1257547
Details
This is a very cool idea, but an odd dataset indeed.. What does a negative value for divisions per day mean exactly?
In any case - the 4th dimension of the dataset was simply binary (2500 or 5000 Lux), so I figured a population-pyramid type visualization might work reasonably well.
Enter PairedBarChart. Unfortunately, such a visualization doesn't accept negative values - so I figured I'd plot the data in base 10 instead. The rest was fairly straight-forward (with some ugly-looking Epilogs and Prologs coming in because I couldn't quite get GridLines to work properly).
Actual Code
raw = Import["http://aquatext.com/tables/algaegrwth.htm", "Data"] /.
   "0..06" -> .06;
data = Cases[raw, {_String, __?NumberQ}, Infinity] /.
   x_List /; First[x] == "Temperature" :> {"Temperature", 5, 5, 10,
     10, 25, 25, 30, 30};
preprocess =
  Reverse@Transpose[
    Transpose[Partition[#, 2]] & /@
     Map[Power[10, #] &, data[[3 ;;, 2 ;;]], {2}]];
center = Row[{#, Invisible[#]}, "\[NegativeThickSpace]"] &;
Finally giving the visualization at the top of this post:
Show[PairedBarChart[##, BarOrigin -> "XAxis",
    PerformanceGoal -> "Speed", Frame -> True, ImageSize -> 1200,
    ChartStyle -> {{Opacity[1], Opacity[0.25]}, None,
      ColorData["SolarColors"] /@ Rescale[{5, 10, 25, 30}]},
    Prolog -> {Black,
      Table[Line[{{i + 0.5, -15}, {i + 0.5, 15}}], {i, 0, 19 4, 4}]},
    FrameLabel -> {{Style["Divisions per day", Black, 24],
       Style["Divisions per day", Black, 24]}, {None, None}},
    PlotLabel -> Style["Specific Growth Rates of Algae", Black, 32],
    Epilog -> {Line[{{0.5, 0}, {76.5, 0}}], Gray, Dashed,
      Table[Line[{{0.5, i + 1}, {19 4 + 0.5, i + 1}}], {i,
        Power[10, {-0.5, 0, 0.25, 0.5, 0.75, 1.0}]}],
      Table[Line[{{0.5, -i - 1}, {19 4 + 0.5, -i - 1}}], {i,
        Power[10, {-0.5, 0, 0.25, 0.5, 0.75, 1.0}]}],
      Text[Style["Relative\nChange", Black, Bold, Italic, 12],
       Scaled[{0.03, 0.495}]],
      Text[Rotate[Style["Lux 5000", Black, 24], 90 Degree],
       Scaled[{0.025, 0.75}]], Opacity[0.5],
      Text[Rotate[Style["Lux 2500", Black, 24], 90 Degree],
       Scaled[{0.025, 0.25}]]}, FrameStyle -> Directive[Black, Thick],
     ChartLegends ->
     Placed[SwatchLegend[
       ColorData["SolarColors"] /@
        Rescale[{5, 10, 25, 30}], {"5\[Degree]", "10\[Degree]",
        "25\[Degree]", "30\[Degree]"}, LegendLayout -> "Row",
       LegendFunction -> (Framed[#, RoundingRadius -> 4,
           FrameStyle -> LightGray, Background -> White] &),
       LegendLabel -> "Temperature [\[Degree]C]",
       LegendMarkerSize -> 30], {0.825, 0.925}], BaseStyle -> 16,
    BarSpacing -> {2, 0, 0},
    FrameTicks -> {{Thread[{Power[10, #], #} &[{-0.5, 0, 0.25, 0.5,
          0.75, 1.0}]],
       Thread[{Power[10, #], #} &[{-0.5, 0, 0.25, 0.5, 0.75,
          1.0}]]}, {Thread[{Range[2.5, 74.5, 4],
         center@Rotate[StringPadLeft[#, 25], 45 Degree] & /@
          data[[3 ;;, 1]]}], None}}] & @@ preprocess,
 ListLinePlot[
  Flatten[MapIndexed[
    Thread[{Range[(#2[[1]] - 1) 4 + .5, 3.5 + (#2[[1]] - 1) 4],
       Rescale[Subtract @@@ Transpose[#1], {-2.5, 2.5}, {-0.5,
         0.5}]}] &, Transpose[preprocess]], 1], Filling -> Axis,
  FillingStyle -> {LightGray, Black}, MaxPlotPoints -> 100,
  InterpolationOrder -> 0, PlotStyle -> Directive[Black, Thin]]]
Suggestions
I welcome any and all suggestions. In particular it would be nice to differentiate the two light intensities further (perhaps hatching instead of opacity?) I was also toying with the idea of connecting the bar charts of the same temperature across species (similar to a parallel coordinates chart), but decided it was already getting too crowded.
Edits
Thanks @l van Veen - Included a relative changes bar to show the difference between light intensities better!
Cheers,
George


