I wanted to display something simple with ListPlot3D. I started out with these values:
a = b = c = 0.01;
cnt = 2;
xmin = -3*a; xmax = 8.9*a; dx = N[Pi/300/cnt^2];
ymin = -2*b; ymax = 2*b; dy = N[Pi/300/cnt^2];
zmin = -6*c; zmax = 4*c; dz = N[Pi/300/cnt^2];
Then I created this list:
lrbmfdxcor =
  Flatten[ParallelTable[{x, y, z}, {x, xmin, xmax, dx}, {y, ymin,
     ymax, dy}, {z, zmin, zmax, dz}], 2];
It looks like this: 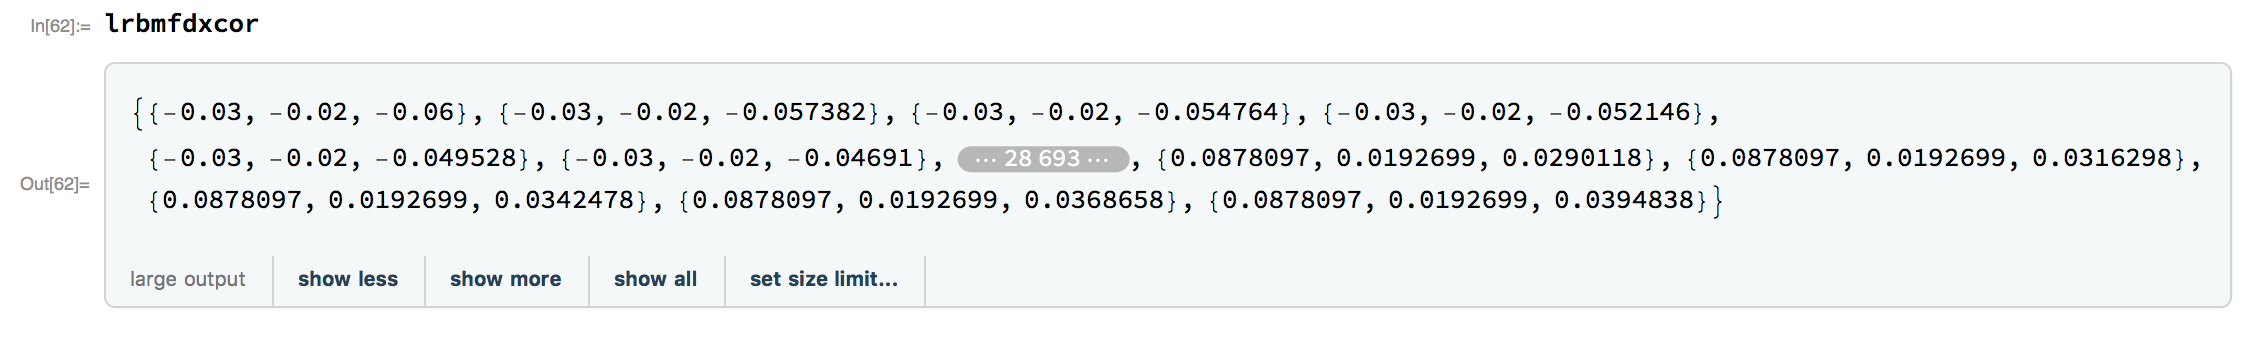
Then I tried to display it with ListPlot3D. I got this, /seeing on edge/: 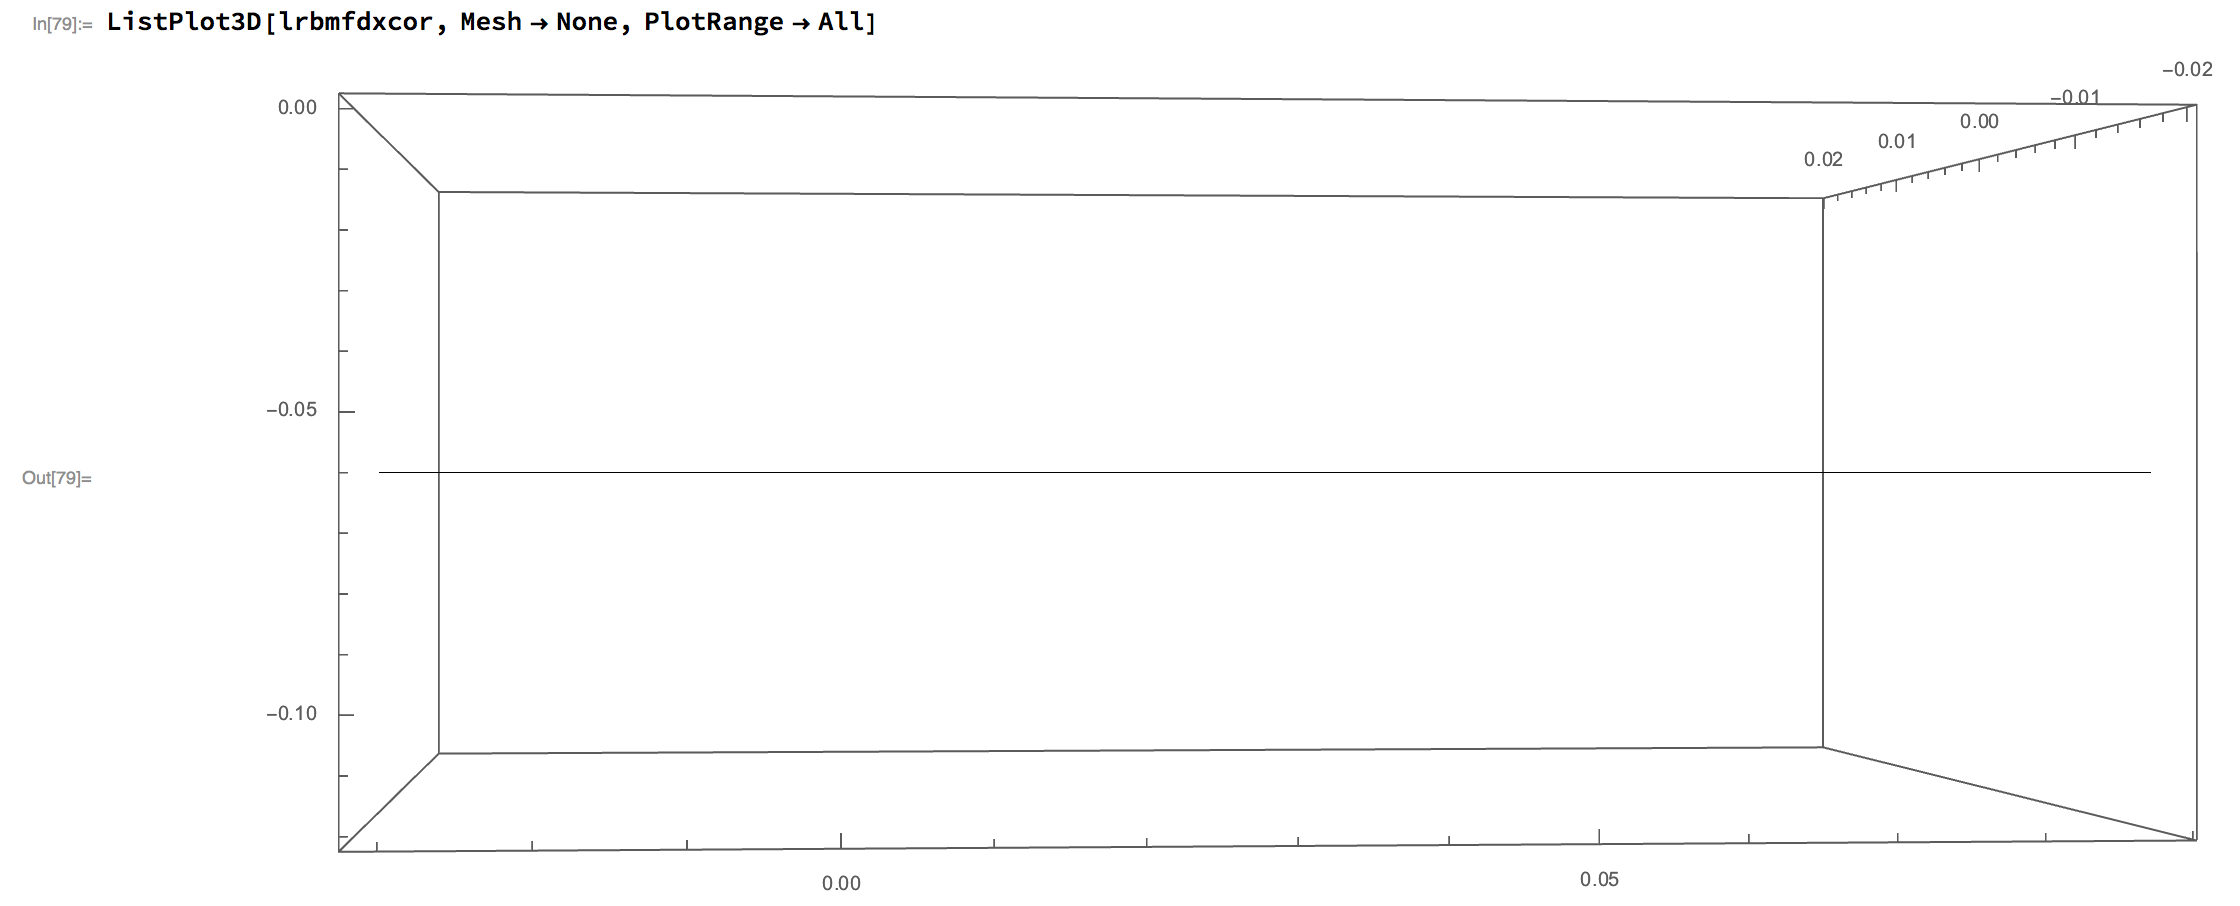
What am I not doing right?
Thanks ahead, János


