Download notebook here: https://amoeba.wolfram.com/index.php/s/XhLblZDwPI3lMCg
Wanted to share a quick project that I found to be a powerful example of the Wolfram Language's use in everyday tasks.
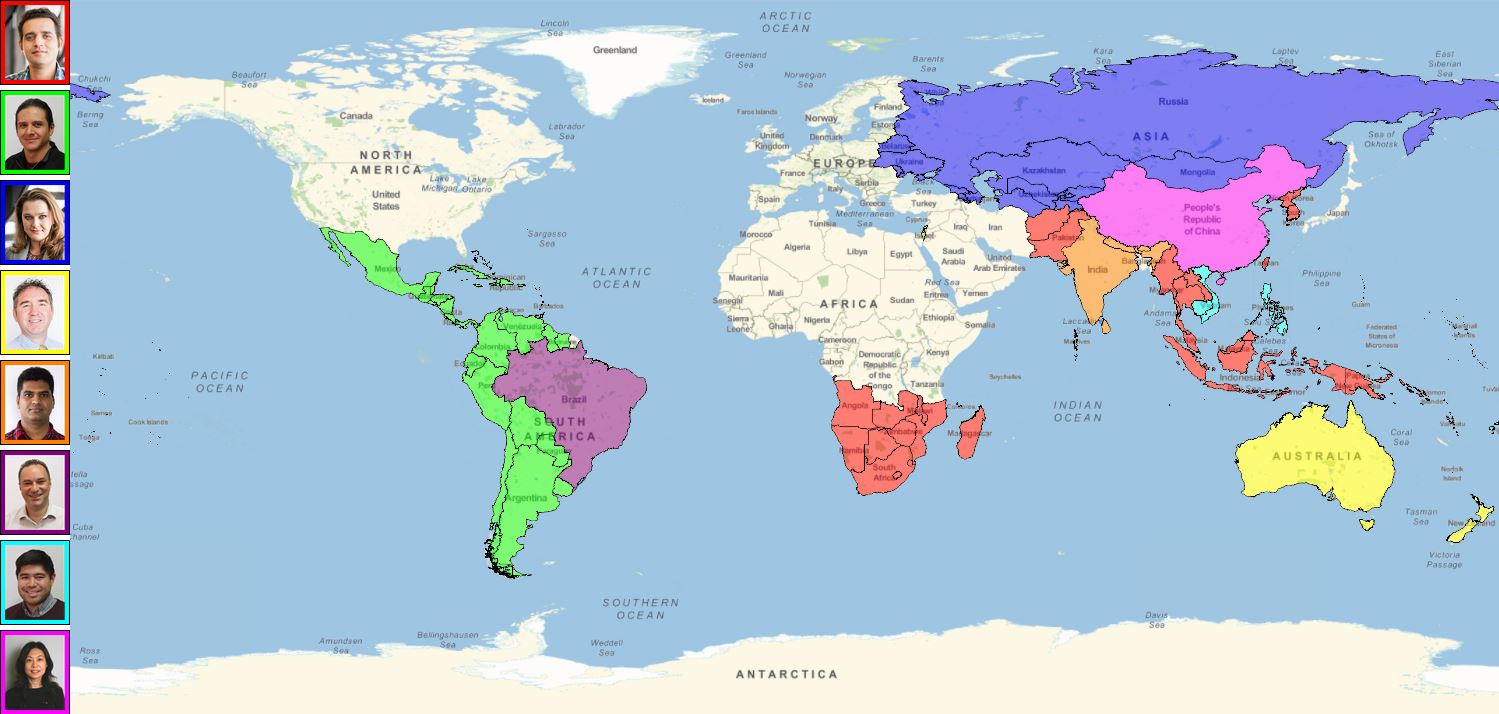
A coworker noticed that our IBD team's territory map was severely out-of-date, so we decided to jump right into Mathematica. Within the hour, we had a brand new graphic for her to share on their internal page. No requests from our design team. Just a quick jump into the Wolfram language!
Semantically Importing Data
Using SemanticImport, I was able to quickly import a CSV file containing the listing of all AE's and their respective countries. There was no additional programming to link the countries to entities; they were simply pulled in and paired to the appropriate CountryData. This will be noticeably important for the GeoGraphics later. Using the GroupBy function, also allowed be to create sublists of the AE's and all of their respective countries.
ibd = SemanticImport[
  "https://amoeba.wolfram.com/index.php/s/qXHPxZpKWEGYKi2/download",
  Automatic, "Rows"]
grouped = GroupBy[ibd, First];
Dividing AE Countries into Color Groups
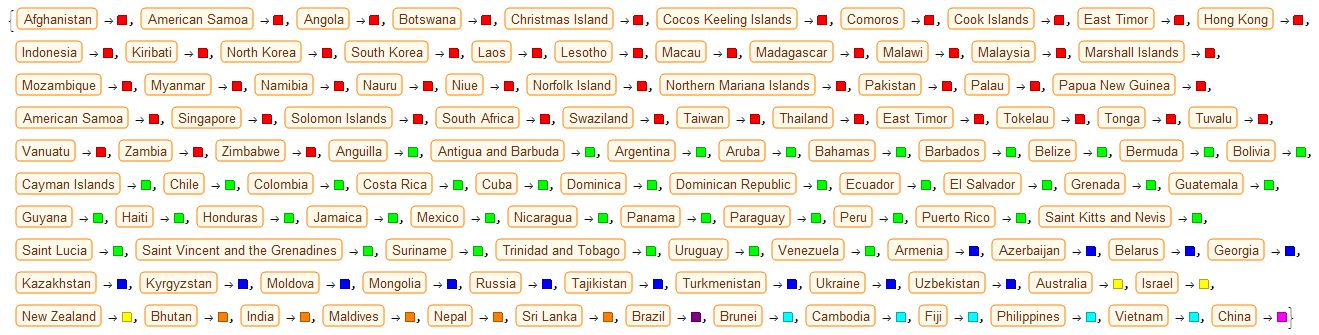
Looking at an example from ref/GeoGraphics, I decided the quickest way for us to plot this on a map was going to be to copy the example from the reference page and use our own list of associations pairing the countries to colors. Using a combination of a few conditionals (While, If, Switch), I was able to iterate through the grouped list and pair each of the countries that were not tagged as "Missing[]" to a color associated with an AE. This allowed me to create a usable list for our GeoGraphics function. I've included a code snippet and an image of the output below.
j = 2;
countryList = {};
While[j < Length[grouped] + 1,
 k = 1;
 While[k < Length[grouped[[j]]] + 1,
  If[MissingQ[grouped[[j]][[k]][[2]]],
   missing = 0,
   Switch[grouped[[j]][[k]][[1]],
    "Farid-Ul-Islam Pasha",
    AppendTo[countryList, grouped[[j]][[k]][[2]] -> RGBColor[1, 0, 0]],
    "Roy Alvarez",
    AppendTo[countryList, grouped[[j]][[k]][[2]] -> RGBColor[0, 1, 0]],
    "Galina Mihalkina",
    AppendTo[countryList, grouped[[j]][[k]][[2]] -> RGBColor[0, 0, 1]],
     "Craig Bauling",
    AppendTo[countryList, grouped[[j]][[k]][[2]] -> RGBColor[1, 1, 0]],
    "Abel Nazareth",
    AppendTo[countryList,
     grouped[[j]][[k]][[2]] -> RGBColor[1, 0.5, 0]],
    "Daniel de Souza Carvalho",
    AppendTo[countryList,
     grouped[[j]][[k]][[2]] -> RGBColor[0.5, 0, 0.5]],
    "Michael Remolona",
    AppendTo[countryList, grouped[[j]][[k]][[2]] -> RGBColor[0, 1, 1]],
    "Xiangqun Chen",
    AppendTo[countryList, grouped[[j]][[k]][[2]] -> RGBColor[1, 0, 1]]
    ]
   ];
  k++;
  ];
 j++;
 ]
countryList
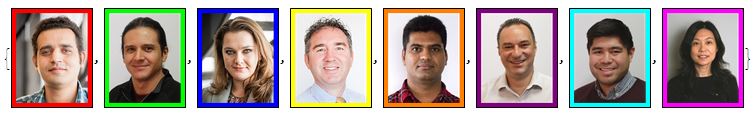
Per request, the AE's pictures were also imported and given backgrounds corresponding to the colors I associated with their countries. This was pretty simple to do with Framed (and ImageResize to make sure they were uniform). Note: the images could not be added as a code snippet, so you'll have to go to the link to the Notebook to get that code. For now, I've just attached that snippet as an image. You can also see the final result below the code snippet.

colors = {RGBColor[1, 0, 0], RGBColor[0, 1, 0], RGBColor[0, 0, 1],
   RGBColor[1, 1, 0], RGBColor[1, 0.5, 0], RGBColor[0.5, 0, 0.5],
   RGBColor[0, 1, 1], RGBColor[1, 0, 1]};
i = 1;
coloredFrames = {};
While[i < Length[groupPics] + 1,
 img = Framed[groupPics[[i]], Background -> colors[[i]],
   ImageSize -> Small];
 AppendTo[coloredFrames, img];
 i++;
 ]
coloredFrames
Creating a Map using GeoGraphics
Again, I simply stole an example from the GeoGraphics reference page and used countryList to replace the list they had used in the example. This made it quick and easy to develop the map without fumbling with syntax that we were unfamiliar with. You can see the code snippet and output for this below. We also organized the AE images and map into a series of Rows and Columns. Note, you may have to adjust the image size of the map per your own screen size.
Row[{
  Column[coloredFrames],
  GeoGraphics[{EdgeForm[
     Directive[Thin,
      Black]], {GeoStyling[#2, Opacity[.5]],
       Tooltip[Polygon[#1], #1[[2]]]} & @@@ countryList},
   ImageSize -> {1350, 680}]
  }]
Conclusion
I'm always trying to find new and interesting ways to use the Wolfram Language in my day-to-day workflow. I thought this was yet another great example of how using things like SemanticImport and the Wolfram Documentation Center can help make somewhat complex visualizations easy to create even for the newest of Wolfram Language users.
Hope you all enjoy!


