Since there is such a huge amount of sectors in total you can reduce that by a fair bit and still get a decent result:
sectorsPerRing[r_] := Floor[5 r];
m2 = MapIndexed[
Mean /@ Partition[#,
Ceiling[dim[[2]]/sectorsPerRing@First@#2],
Ceiling[dim[[2]]/sectorsPerRing@First@#2],
{1, 1}, {}] &
, m];
SectorChart[Map[Style[{1, 10}, ColorData["Rainbow"][#]] &, m2, {2}]]
This is however still quite slow, it's quite a bit faster to make a rougher approximation of the shape of each sector:
m = ws[[1, 1]];
(* Disk sector from from rmin to rmax between angles amin and amax, using n points *)
diskSector[c_, {rmin_, rmax_}, {amin_, amax_}, n_] := With[{
pts = ({Cos[#], Sin[#]} & /@ Range[amin, amax, (amax - amin)/n])
},
Polygon[Join[rmin pts, Reverse[rmax pts]]]
]
sectorsPerRing[r_] := Floor[10 r];
(* Given as n to diskSector, 3 or even 2 works fine here *)
pointsPerSector = 3;
dim = Dimensions[m];
ringChart = MapIndexed[
With[{
rmin = (First@#2 - 1),
rmax = First@#2,
columns = Mean /@ Partition[#,
Ceiling[dim[[2]]/sectorsPerRing@First@#2],
Ceiling[dim[[2]]/sectorsPerRing@First@#2],
{1, 1}, {}]
},
MapIndexed[
{ColorData["SunsetColors"][#],
diskSector[
{0, 0},
{rmin, rmax},
(2. Pi)/Length[columns] {(First@#2 - 1), First@#2},
pointsPerSector]} &
, columns]
] &
, m];
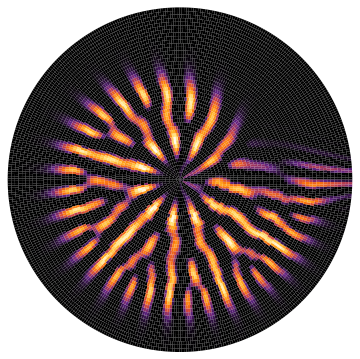
Graphics[ringChart]
This computes and renders in just a few seconds: