Message Boards Message Boards

3
|
11487 Views
|
5 Replies
|
9 Total Likes
View groups...
Share
Share this post:

Wrapping ArrayPlot or MatrixPlot around a circle

I read in documentation the following:
SectorChart is a generalization of PieChart

I am not sure what is meant exactly, but I feel it could help me with the following task.

Imagine a rectangular matrix with real values. ArrayPlot or MatrixPlot will produce rectangular visualizations. How can these visualizations be made circular? Given a matrix - these are the rules:
  • Visualization consists of concentric rings subdivided in sectors
  • Number of rings is equal to number of matrix rows
  • Number of sectors is equal to number of matrix columns
  • Ring widths are equal
  • Sector arcs are equal
  • Color of each sector is related to the value of its matrix element
Thank you!
Darya
POSTED BY: Darya Aleinikava
5 Replies
Posted 12 years ago
This is a bit of a hack, but something like this?
m = Table[m n/70, {m, 10}, {n, 7}];

SectorChart[Map[Style[{1, 10}, ColorData["Rainbow"][#]] &, m, {2}]]
POSTED BY: Jari Kirma
Yes, this exactly what I need, thank you! I have 2 questions.
  • Changing 2nd number here {1, 10} changes ring's width. But 1st number does not influence anything. What is it for? I guess this is what "a bit of a hack" referes to?
  • I tried using it in this answer WaveletScalogram in polar coordinates but it was extremely slow - any way to speed this up?

Speed is a really big issue here.
cwd = ContinuousWaveletTransform[data, GaborWavelet[6], {4, 12}, WaveletScale -> 100];
ws = WaveletScalogram[cwd, All, Re, ColorFunction -> "CherryTones"];

SectorChart[
Map[Style[{1, 100}, ColorData["SunsetColors"][#]] &,
  ws[[1, 1]][[All, 1 ;; -1 ;; 10]], {2}], PerformanceGoal -> "Speed",
ChartStyle -> EdgeForm[None], Background -> Black]

POSTED BY: Darya Aleinikava
Posted 12 years ago
Now that I see your practical application, my solution approach is comically impractical. What is your primary goal on this diagram, apart from its' circular form? I assume it isn't - after all - that every tiny sector is actually represented as a perfect piece in the puzzle...

And talking of {1, 10}: 1 is not the trick. It's just the value to make all sectors of similar size. 10 is there to guarantee there are no voids between co-centric rings. After all, SectorChart is primarily meant for "presentation graphics", not this kind of coordinate system mapping.
POSTED BY: Jari Kirma
Posted 12 years ago
Speaking in somewhat uncertain terms, http://mathematica.stackexchange.com/a/32935/3056 is a good answer to this. Being pedantic, it is not a perfect one, but it works. ImageTransformation is good for a rasterized mapping for this sort of a job - if you don't need clearly discrete diagrams such as one I provided before.
POSTED BY: Jari Kirma
Posted 12 years ago
Since there is such a huge amount of sectors in total you can reduce that by a fair bit and still get a decent result:
sectorsPerRing[r_] := Floor[5 r];
m2 = MapIndexed[
   Mean /@ Partition[#,
      Ceiling[dim[[2]]/sectorsPerRing@First@#2],
      Ceiling[dim[[2]]/sectorsPerRing@First@#2],
      {1, 1}, {}] &
   , m];
SectorChart[Map[Style[{1, 10}, ColorData["Rainbow"][#]] &, m2, {2}]]
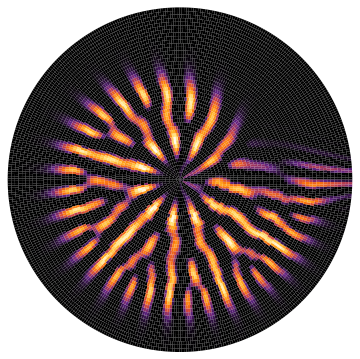
This is however still quite slow, it's quite a bit faster to make a rougher approximation of the shape of each sector:
 m = ws[[1, 1]];
 
 (* Disk sector from from rmin to rmax between angles amin and amax, using n points *)
 diskSector[c_, {rmin_, rmax_}, {amin_, amax_}, n_] := With[{
    pts = ({Cos[#], Sin[#]} & /@ Range[amin, amax, (amax - amin)/n])
    },
   Polygon[Join[rmin pts, Reverse[rmax pts]]]
   ]
 
sectorsPerRing[r_] := Floor[10 r];
(* Given as n to diskSector, 3 or even 2 works fine here *)
pointsPerSector = 3;
dim = Dimensions[m];

ringChart = MapIndexed[
   With[{
      rmin = (First@#2 - 1),
      rmax = First@#2,
      columns = Mean /@ Partition[#,
         Ceiling[dim[[2]]/sectorsPerRing@First@#2],
         Ceiling[dim[[2]]/sectorsPerRing@First@#2],
         {1, 1}, {}]
      },
     MapIndexed[
      {ColorData["SunsetColors"][#],
        diskSector[
         {0, 0},
         {rmin, rmax},
         (2. Pi)/Length[columns] {(First@#2 - 1), First@#2},
         pointsPerSector]} &
      , columns]
     ] &
   , m];
Graphics[ringChart]
This computes and renders in just a few seconds:
POSTED BY: Simon Schmidt
Reply to this discussion
Community posts can be styled and formatted using the Markdown syntax.
Reply Preview
Attachments
Remove
or Discard

Group Abstract Group Abstract