Hello,
I'm relatively new to mathematica and have what is probably a very basic question.
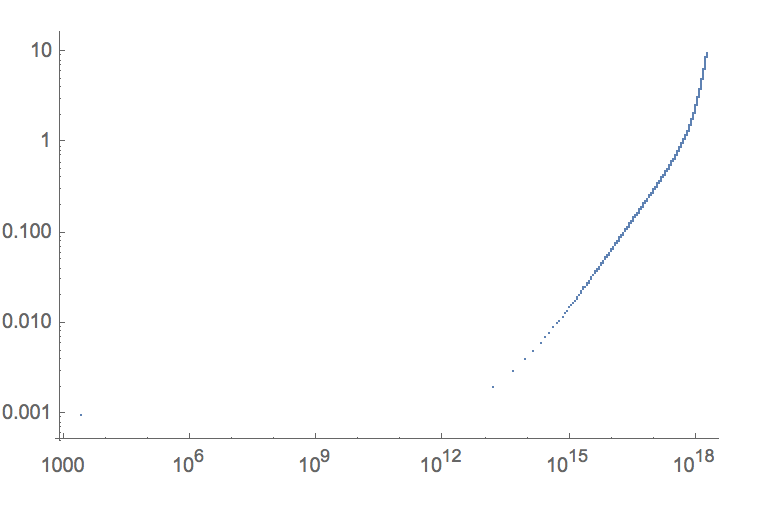
I'm making a List Log Log plot, from a list created with the Table function. The table function iterates in integer values so when I plot my list log log plot all of the data points are bunched up at the end, as opposed to spaced logarithmically. I realize I probably need to just take the log of some value but I'm drawing a blank. Code below:
time = Table[(1/H)*NIntegrate[(((8.4*10^(-5))/a^2) + (.3/a) + (.7*a^2))^(-1/2), {a,0, i/1000}], {i, 10^-5, 10000}] ;
listA = Table[i/1000, {i, 1, 10000}];
data = Transpose[{time, listA}];
bench1 = ListLogLogPlot[data]
Any help would be greatly appreciated.
Thanks!


