Message Boards Message Boards

0
|
3832 Views
|
4 Replies
|
0 Total Likes
View groups...
Share
Share this post:

[?] Space data points evenly on LogLog Plot?

Posted 6 years ago

Hello,

I'm relatively new to mathematica and have what is probably a very basic question.

I'm making a List Log Log plot, from a list created with the Table function. The table function iterates in integer values so when I plot my list log log plot all of the data points are bunched up at the end, as opposed to spaced logarithmically. I realize I probably need to just take the log of some value but I'm drawing a blank. Code below:

time = Table[(1/H)*NIntegrate[(((8.4*10^(-5))/a^2) + (.3/a) + (.7*a^2))^(-1/2), {a,0, i/1000}], {i, 10^-5, 10000}] ;  
listA = Table[i/1000, {i, 1, 10000}];  
data = Transpose[{time, listA}];  
bench1 = ListLogLogPlot[data]  
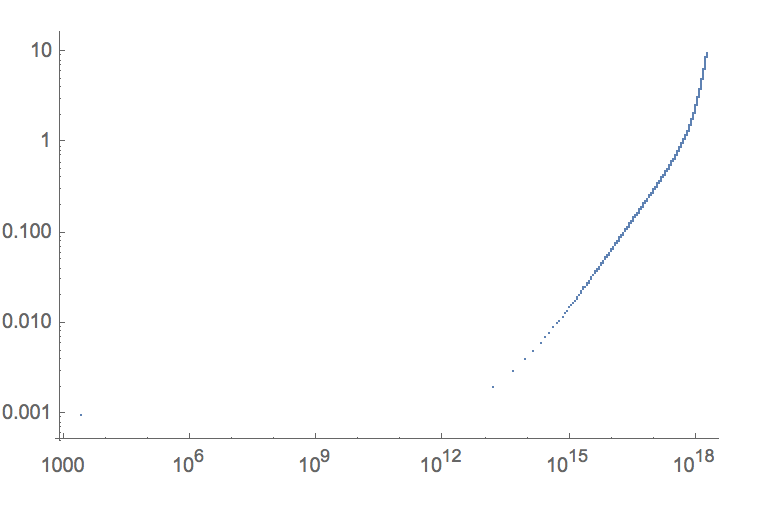
Log Plot

Any help would be greatly appreciated.

Thanks!

POSTED BY: ian gullett
4 Replies
Posted 6 years ago

Hi,

I'd recommend to create "data" in a single line and regarding your log-problem: just take i as the exponent of 10 and let the table run from -5 to 4: I did some line breaks to highligh the changes

data = Table[{(1/H)NIntegrate[(((8.410^(-5))/a^2) + (.3/a) + (.7*a^2))^(-1/2), {a,0, 10^i/1000}],10^i/1000}, {i, -5, 4}] ;
bench1 = ListLogLogPlot[data] 

Hope that helps.

POSTED BY: Björn Arnold

Put "10^" before "i" and change your range

time = Table[(1/H)NIntegrate[(((8.410^(-5))/a^2) + (.3/a) + (.7*a^2))^(-1/2), {a,0, 10^i/1000}], {i, -5, 4}] ;
listA = Table[10^i/1000, {i, 0, 4}];
data = Transpose[{time, listA}];
bench1 = ListLogLogPlot[data]

Edit: Sorry, the forum said there were 0 responses, but one had already been posted. Same answer as above

POSTED BY: Eric Smith
Posted 6 years ago

Thank you for the help.

I've got the following code to work, however I'm unsure of how to change the number of data points. For example, If I wanted to change the number of data points from 10 to 100, what value do I change?

data = Table[{(1/H) NIntegrate[((8.4*10^-5)/a^2 + .3/a + .7*a^2)^(-1/2), {a, 0, 10^i/1000}], 10^i/1000}, {i, -5, 4}];     
bench1 = ListLogLogPlot[data]
POSTED BY: ian gullett

Put 0.1 as the third argument in the Table’s range. Like this:

data = Table[{(1/H) NIntegrate[((8.4*10^-5)/a^2 + .3/a + .7*a^2)^(-1/2), {a, 0, 10^i/1000}], 10^i/1000}, {i, -5, 4, 0.1}];     
bench1 = ListLogLogPlot[data]
POSTED BY: Eric Smith
Reply to this discussion
Community posts can be styled and formatted using the Markdown syntax.
Reply Preview
Attachments
Remove
or Discard

Group Abstract Group Abstract