Group Abstract Group Abstract

Message Boards Message Boards

Neural network regression with error bars

POSTED BY: Sjoerd Smit
9 Replies

Hi Joydeep, thank you for your questions.

If you don't use any L2-regularisation, this is really just equivalent to setting λ2 = 0. All of the formulas should still work and for the homoscedastic model this does indeed reduce the prediction error to the sample varience. I'll leave it up to you to decide if it's actually wise to do this, though, since turning off the L2-regularisation might cause sever overfitting. The dropout layers will prevent overfitting to a certain extend as well, but personally I'd recommend keeping some degree of L2-regularisation anyway. And honestly, the best way to go about it, is to explore different values of dropout probability and λ2 to see what gives the best results.

POSTED BY: Sjoerd Smit

enter image description here - Congratulations! This post is now a Staff Pick as distinguished by a badge on your profile! Thank you, keep it coming!

POSTED BY: EDITORIAL BOARD
Attachments:
POSTED BY: Sjoerd Smit

Really cool stuff,

Why does the variance when extrapolating only get big to the right of one the images? From a Gaussian processes perspective, I would expect it to happen whenever you get away from a data point.

POSTED BY: Eduardo Serna

Well, the variance does increase away from the data, just maybe not as quickly as you'd expect. From what I understood, this depends on the details of your network (the activation function, in particular) and the training parameters. Ultimately, those factors decide what kind of Gaussian process kernel you're effectively using, but the connection between the two isn't straightforward (and an active area of research, as far as I could figure out).

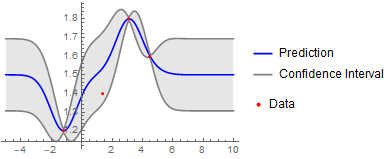
Also, Gaussian processes do not necessarily produce arbitrarily large variance away from the data from what I've seen. If you take a simple example from the documentation of Predict, you can quite easily get a constant error band away from the data:

data = {-1.2 -> 1.2, 1.4 -> 1.4, 3.1 -> 1.8, 4.5 -> 1.6}; p = 
 Predict[data, Method -> "GaussianProcess"];
Show[Plot[{p[x],
   p[x] + StandardDeviation[p[x, "Distribution"]], 
   p[x] - StandardDeviation[p[x, "Distribution"]]},
  {x, -5, 10},
  PlotStyle -> {Blue, Gray, Gray},
  Filling -> {2 -> {3}},
  Exclusions -> False,
  PerformanceGoal -> "Speed", 
  PlotLegends -> {"Prediction", "Confidence Interval"}], 
 ListPlot[Ldata, PlotStyle -> Red, PlotLegends -> {"Data"}]]
enter image description here

POSTED BY: Sjoerd Smit

I would have to look into it, but my implementation with an exponential covariance, doesn't have a standard deviation that levels off when extrapolating. It has been a while so it could be a bug on my side, or, more likely, something conceptually different.

POSTED BY: Eduardo Serna
POSTED BY: Sjoerd Smit

I will need to talk to you when I get back into this.

POSTED BY: Eduardo Serna
Reply to this discussion
Community posts can be styled and formatted using the Markdown syntax.
Reply Preview
Attachments
Remove
or Discard
