If you're in touch with iconic comedy films from the year 2000 onward (or just a knowledgeable Sandra Bullock fan), you've undoubtably seen the movie Miss Congeniality: the tale of a surly undercover FBI agent in the Miss USA Pageant who ends up making genuine human connections with people she didn't expect to, eventually saving their lives from a depraved former pageant queen.
Anyway, amongst all the amazing quotes scattered throughout the movie (who could forget the iconic "I'm gliding here!" scene?), there's a moment where Miss Rhode Island is asked about her idea of the perfect date:
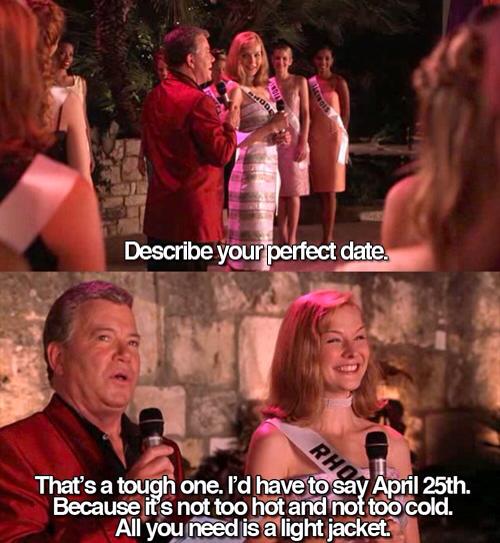
As satirically funny as it was, she was right! Today was an amazing day, weather-wise, and we can see that with the Wolfram Language:
AirTemperatureData[Here, Today, Mean]
(*Quantity[53.1, "DegreesFahrenheit"]*)
I really did only need a light jacket!
While I had a nice day, was this same April 25th being experienced by everyone around the country? Surely the state of Rhode Island was, but what about the rest of the US? I decided to investigate...
Getting the Data Set
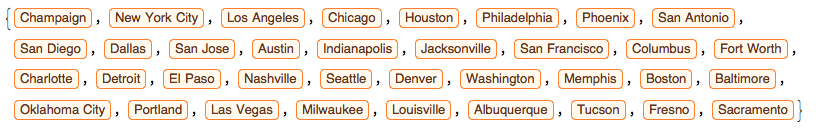
I started by combining the relevant Entity cities. To keep things simple (and to keep cell evaluation under a minute because I'm impatient), I combined my local location here at WRI with the 35 largest cities across the US:
Clear@cities
cities = Join[{Entity[
    "City", {"Champaign", "Illinois", "UnitedStates"}]},
  CityData[{Large, "UnitedStates"}][[1 ;; 35]]
  ]
I then got their associated GeoPosition:
Clear@positions
positions = GeoPosition /@ cities;
And their temperatures:
Clear@temps
temps = AirTemperatureData[#, Today, Mean] & /@ positions

You can immediately see I was missing a value. To avoid any issues when plotting, I decided to drop both the value in question, and whatever city it was from:
Clear@tempsClean
tempsClean = Drop[temps, {6}];
Clear@citiesClean
citiesClean = Drop[cities, {6}];
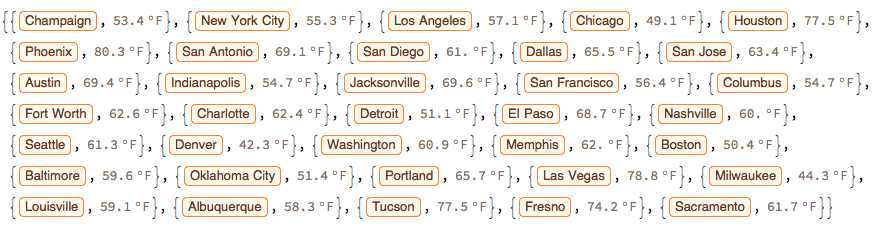
Finally, I combined these into real coordinates for plotting:
Clear@coordinates
coordinates = Partition[
  Riffle[citiesClean, tempsClean],
  2]
Visualizing April 25th Across the US
To see if April 25th really is the perfect date, we need to set some assumptions beforehand. A priori we know that I indeed had a perfect day. According to AirTemperatureData, that temperature was around 53 degrees F. It was also sunny here, so for simplicity, I will assume that's the case for other cities across the country.
Based on this, I feel safe to assume that "not too hot and not too cold" has a floor value of 50 degrees F. Since I don't need a jacket at or above room temperature, I will also make the assumption that 70 degrees F is "too hot" and thus outside the range of "not too hot and not too cold". Since I am assuming sunshine, I would also argue that 65 degrees is also "too hot" for a light jacket, and will use 65 degrees F as my ceiling.
So, with all of that out of the way, let's plot:
ListPlot[coordinates[[All, 2]] -> coordinates[[All, 1]],
 Frame -> {False, True},
 PlotLabel -> "Mean Temperature of US Cities on April 25th",
 FrameLabel -> {"Fahrenheit"}, PlotTheme -> "Detailed",
 GridLines -> {{}, {50, 65}}]
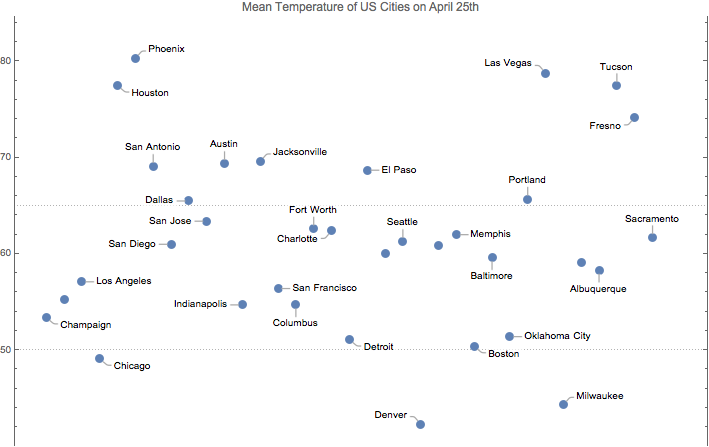
Unsurprisingly, cities located in the south and southwest regions of the US are just above the range of "not too hot and not too cold", and cities in the northern midwest (Milwaukee, Chicago), or in elevated regions (Denver) are just below the specified range...they probably need a bit more than a light jacket to deal with their April 25th.
The only value that seems to be an outlier is Portland, Oregonwhich lies just above the specified range. What about Portland today made it noticeably warmer than other cities, given it's location in the Pacific Northwest? I don't really know! And I don't think I would based on this simple analysis either.
For Next Time
Next time (i.e.; when I am less constrained by the 24 hr time limit of April 25th), I think I'd like to try creating a formula that not only makes use of AirTemperatureData but some other factors that would contribute to what you would actually feel when you step outside: humidity, wind speeds, etc. That'd result in a much more varied understanding of the cities: not only would I know which cities fell into the "just a light jacket" range, but why. Consequently, I would likely gain insight into why Portland (or any other outlier city for the topic at hand) was a bit warmer than expected.
But, all in all, this was a really fun topical exercise, and a great way to fuse my love of memes and pop culture with some quantitative analysis.


