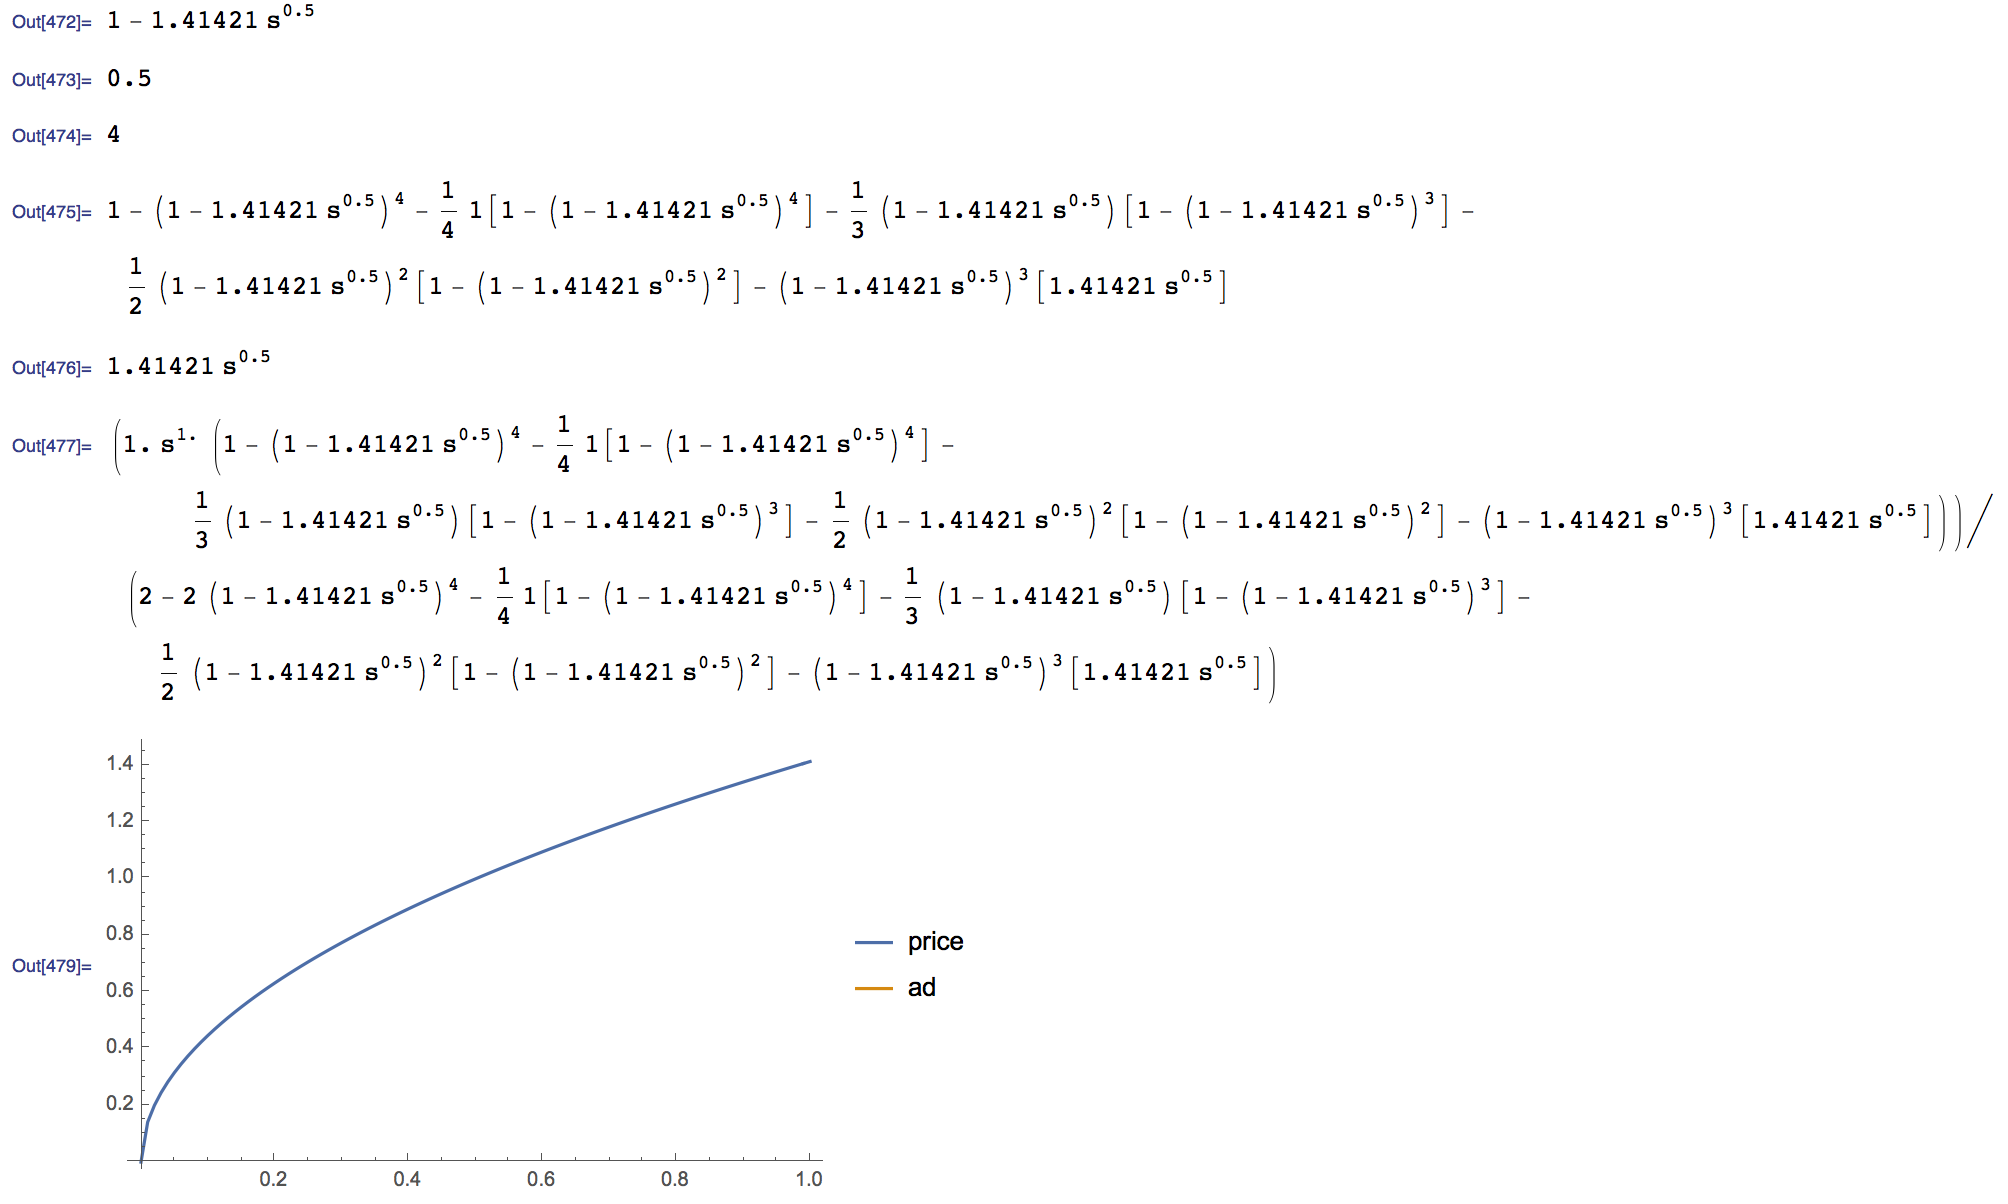
Consider the following code:
x =.
    s =.
    x = 1 - (2 s)^0.5
    \[Alpha] = 0.5
    n = 4
    A = 1 - x^n - \!\(
    \*UnderoverscriptBox[\(\[Sum]\), \(k = 0\), \(\(-1\) + n\)]
    \*FractionBox[\(
    \(\*SuperscriptBox[\(x\), \(k\)]\)[1 -
    \*SuperscriptBox[\(x\), \(\(-k\) + n\)]]\), \(\(-k\) + n\)]\)
    p = 1 - x
    b = \[Alpha] A*(1 - x)^2/(A + 1 - x^n)
    data = Table[Table[{s, f}, {s, 0, 1, 0.01}], {f, {p, b}}];
    ListLinePlot[data, PlotLegends -> {price, ad}]
In Mathematica, I want to show both lines of p (for price) and b (for ad), but why line of b is missing?