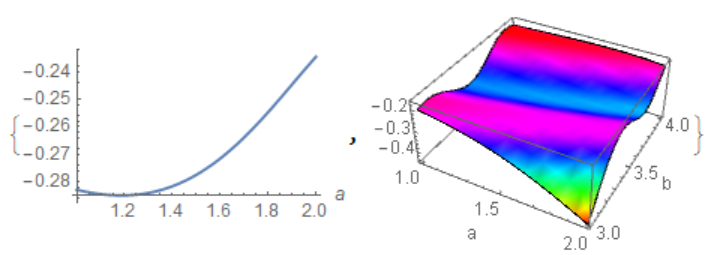
OK! Let me take a look at the general cases on this particular example:
u = Flatten[
  Table[{a, b, NIntegrate[Sin[x^a - x^b], {x, 1, 2}]}, {a, 1,
    2, .1}, {b, 3, 4, .1}], 1];
ListPlot3D[u, AxesLabel -> {"a", "b", ""}, Mesh -> None,
 ColorFunction -> Hue]
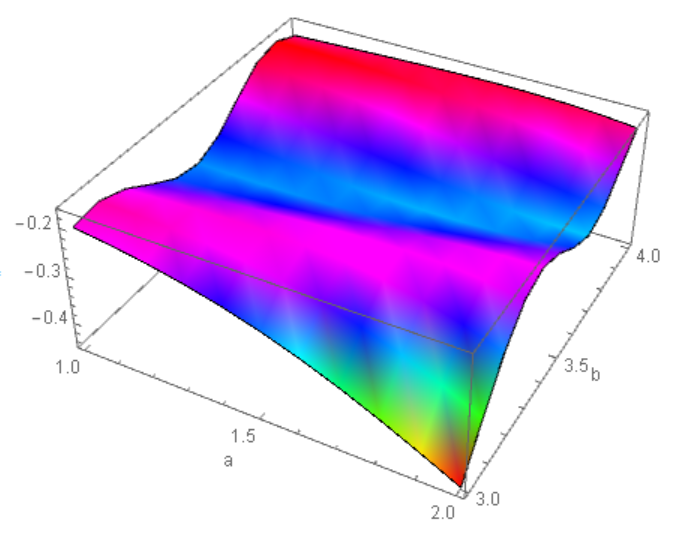
Fu = Interpolation[u]
{Plot[Fu[a, 3.5], {a, 1, 2}, AxesLabel -> Automatic],
 Plot3D[Fu[a, b], {a, 1, 2}, {b, 3, 4}, Mesh -> None,
  ColorFunction -> Hue]}